XB-IMG-192681
Xenbase Image ID: 192681
|
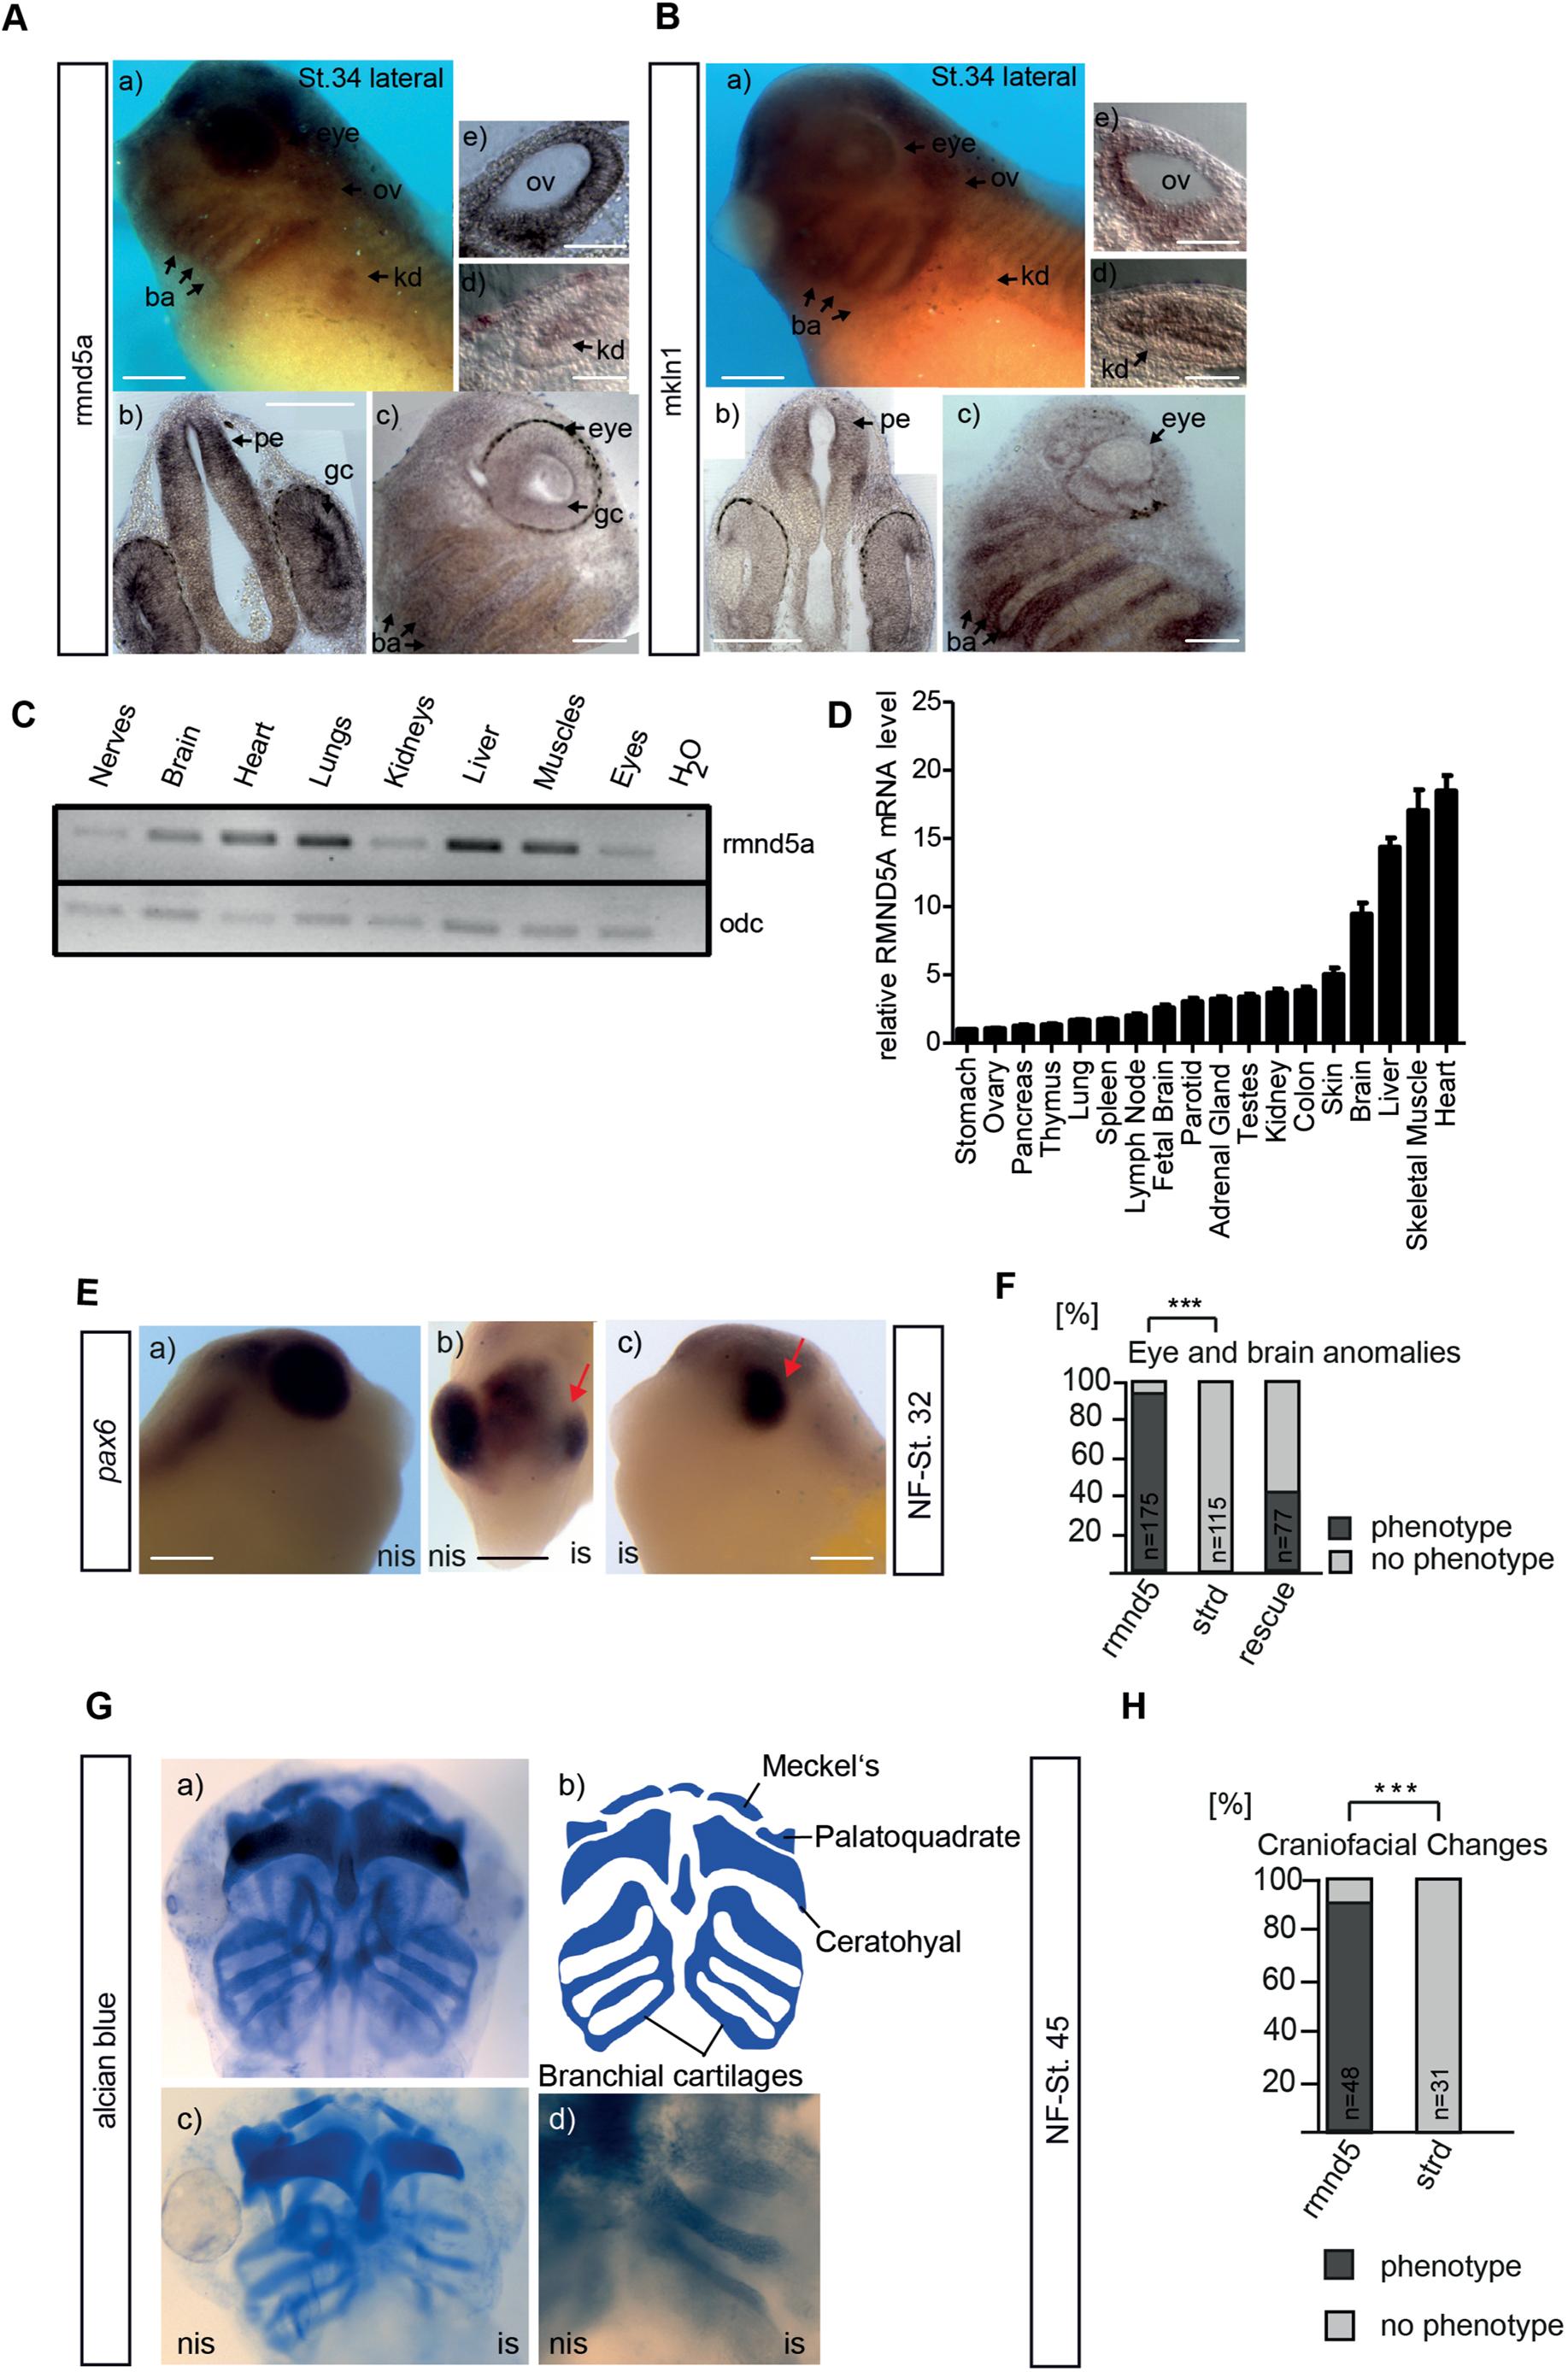
Fig. 6. GID genes are expressed in ciliated organs during X. laevis development. Spatial analysis of expression of GID complex subunits rmnd5a (A) and mkln1 (B) in X. laevis. WMISH of WT X. laevis embryos at developmental stage 34 (St. 34; lateral views in Aa and Ba) and the corresponding transverse (b,e,d) and sagittal (c) sections (ov, otic vesicle; pe, prosencephalon; ba, branchial arches; kd, pronephric kidney; gc, ganglion cells). Images are representative of three experiments. Images in Ab and Bb are the result of tiling multiple fields of view. Scale bars: 300 μm in Aaâc and Baâc; 100 μm in Ad, Ae, Bd and Be. (C) RT-PCR analysis of rmnd5a expression in distinct tissues of X. laevis. RT-PCR of odc1 (odc) is shown as an RNA input control (bottom). Data are representative of three experiments. (D) Quantification of relative mRNA levels of human RMND5A in various tissues. cDNA was reverse transcribed from the indicated RNA samples. β-actin (ACTB) levels were used as the qPCR internal control. RMND5A mRNA of different tissues is compared to its corresponding housekeeping gene (ACTB) in percent. In most tissues, RMND5A is expressed in an amount equivalent to more than 5% of the housekeeping gene. Mean±s.e.m., n=3. (EâH) Rmnd5a alteration is associated with ciliopathy-like phenotypes.
(E) rmnd5a-mo-injected embryos (NF-St. 32, NF stage 32; is, injected side; nis, non-injected side) were used for in situ hybridization with the pax6 marker. The red arrow in images b and c indicates the eye of the injected side of the morpholinos. Scale bars: 300 μm. (F) Quantitative representation of rmnd5a-mo (rmnd5), negative control standard-mo (strd) and rescue (co-injection with rmnd5a-mo and synthetic Rmnd5a-encoding RNA) phenotypes, presented as a bar graph (embryos with phenotype as a percentage of the total number of embryos scored; black, phenotype; gray, no phenotype). n=number of injected embryos analyzed for the respective marker. ***Pâ¤0.001 (chi-square test).
(G) Analysis of the formation of head cartilage by Alcian Blue cartilage staining in swimming tadpoles at NF stage 45 (NF-St. 45). Meckelâs cartilage, ceratohyal cartilage, branchial cartilage and basihyal cartilage is shown in control standard- mo-injected (a) and rmnd5a-mo-injected (c,d) tadpoles (is, injected side; nis, non-injected side). A schematic of WT cartilage formation is shown in image b. (H) Quantitative representation of craniofacial changes in rmnd5a-mo-injected and standard-mo-injected tadpoles, with phenotypes displayed as a bar graph (embryos with a phenotype as a percentage of the total number scored; black, phenotype; gray, no phenotype). n=number of injected embryos analyzed. ***Pâ¤0.001 (chi-square test). Image published in: Hantel F et al. (2022) © 2022. Creative Commons Attribution license
Image source: Published
Larger Image Printer Friendly View |