Cell clusters softening triggers collective cell migration in vivo
Cristian L Marchant, Abdul N Malmi-Kakkada, Jaime A Espina, Elias H Barriga
Nat Mater. 2022 Aug 15. doi: 10.1038/s41563-022-01323-0. Online ahead of print.
Click here to view article at Nature Materials.
Click here to view article at PubMed.
Abstract
Embryogenesis, tissue repair and cancer metastasis rely on collective cell migration. In vitro studies propose that cells are stiffer while migrating in stiff substrates, but softer when plated in compliant surfaces which are typically considered as non-permissive for migration. Here we show that cells within clusters from embryonic tissue dynamically decrease their stiffness in response to the temporal stiffening of their native substrate to initiate collective cell migration. Molecular and mechanical perturbations of embryonic tissues reveal that this unexpected mechanical response involves a mechanosensitive pathway relying on Piezo1-mediated microtubule deacetylation. We further show that decreasing microtubule acetylation and consequently cluster stiffness is sufficient to trigger collective cell migration in soft non-permissive substrates. This suggests that reaching an optimal cluster-to-substrate stiffness ratio is essential to trigger the onset of this collective process. Overall, these in vivo findings challenge the current understanding of collective cell migration and its physiological and pathological roles.
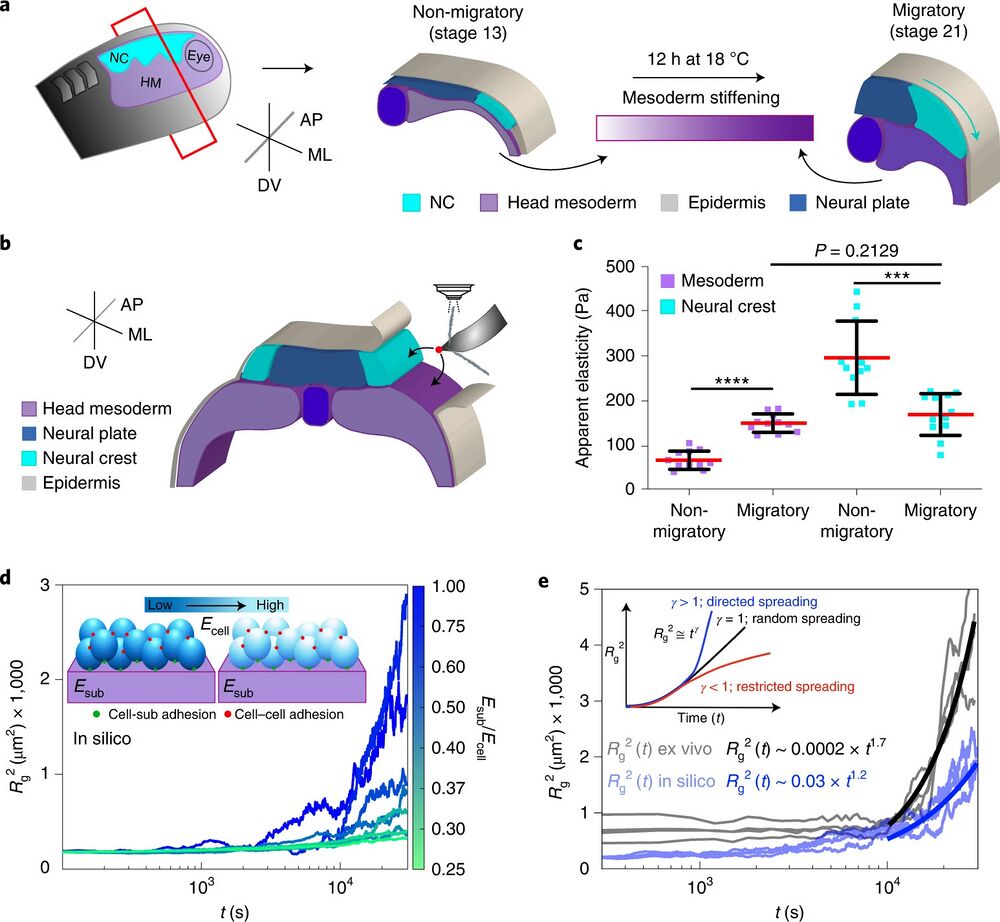
Fig. 1 | NC cells reduce their stiffness at the onset of CCM in vivo. a, Diagram represents a cross-section of a X. laevis embryo showing the development of NC (HM, head mesoderm; ML, mediolateral; AP, anteroposterior; DV, dorso-ventral). Cephalic or cranial NC originates from ectoderm at the border of the neural plate and their CCM is triggered by stiffening of the head mesoderm, the NC migratory substrate. b, Schematic showing the regions measured by iAFM in wild-type or treated embryos, black arrows point to the recorded regions. c, Spread of data for each condition as stated in the figure, red lines represent the mean and whiskers the standard deviation (s.d.) (two-tailed t-test ****P < 0.0001, ***P = 0.0004, CI = 95%, nnon-migratory mesoderm = 12, nmigratory mesoderm = 11, nnon-migratory NC = 11, nmigratory NC = 12 embryos; 64 indentations were performed per embryo). d, Top left inset in the graph correspond to a simplified representation of our mathematical model used to obtain Rg2. Briefly, the behaviour of cells (which are connected between them, red dots, and connected to the substrate, green dots) was simulated at varying stiffness values when spreading on a substrate of fixed stiffness (magenta). The result of these simulations is shown as a chart were Rg2 calculations under different Esub/Ecell regimes are presented, lines represent Rg2 over time. e, Comparison of in silico (shaded blue lines) and ex vivo (shaded black lines) Rg2 calculations (Esub/Ecell > 1 in both conditions). Inset showing potential outcomes of Rg2 ≅ tγ as an output of cell directionality; directionality extracted from in silico (solid blue lines) and ex vivo (solid black lines) Rg2 ≅ tγ are shown.

Fig. 2 | Microtubule deacetylation allows the onset of CCM in vivo. a–c, NC undergo deacetylation in vivo. a, Schematic showing the plane of sectioning (HM, head mesoderm; ML, mediolateral; AP, anteroposterior; DV, dorso-ventral). b, In the upper panel, representative confocal projections of transverse cryosections showing highlighted NC nuclei (cyan) and fibronectin (magenta) at non-migratory and migratory stages; in the lower panel, colour-coded projections of the acetylated α-Tubulin channel are shown (scale bar, 100 μm); an inset from the NC region emphasizing the signal differences between both stages is shown in the upper right corner (scale bar, 50 μm). a.u., arbitrary units. c, Normalized acetylated α-Tubulin fluorescence intensity; spread of data from the indicated conditions is shown, red lines represent median and whiskers represent interquartile ranges (two-tailed Mann–Whitney ****P < 0.0001, CI = 95%, nnon-migratory = 17, nmigratory = 17 embryos). d–o, Graft experiments. d, Diagram of wild-type (WT) stage 17.5 (premigratory) NC grafted into stage 17.5 wild-type host embryos. e, Diagram of hyperacetylated stage 17.5 NC grafted into stage 17.5 wild-type host embryos. f,g, Embryos displaying the results of the grafts shown in d and e, respectively. h, Percentage of embryos displaying NC migration; histograms represent the mean and error bars the s.d. i, Normalized displacement of NC along the dorso-ventral axis; red lines represent mean and whiskers s.d. (two-tailed t-test, ****P < 0.0001, CI = 95. In f and g, ncontrol = 22, nhyperacetylated = 22 animals). j, Diagram of wild-type stage 17.5 NC grafted into wild-type stage 14 (non-migratory) host embryos. k, Diagram of hypoacetylated stage 17.5 NC grafted into stage 14 wild-type host embryos. l,m, Embryo displaying the results of the grafts shown in j and k, respectively. Open neural plate highlighted in white lines with its width indicated by red lines. n, Percentage of embryos displaying NC premature migration; histograms represent media, error bars s.d. o, Normalized displacement of NC along the dorso-ventral axis; red lines represent mean and whiskers s.d. (two-tailed t-test, ****P < 0.0001, CI = 95. In l and m, ncontrol = 20, nhypoacetylated = 20 animals). Panels in b,f,g,l,m are representative examples of at least three independent experiments (scale bars in f,g,l,m, 200 μm).
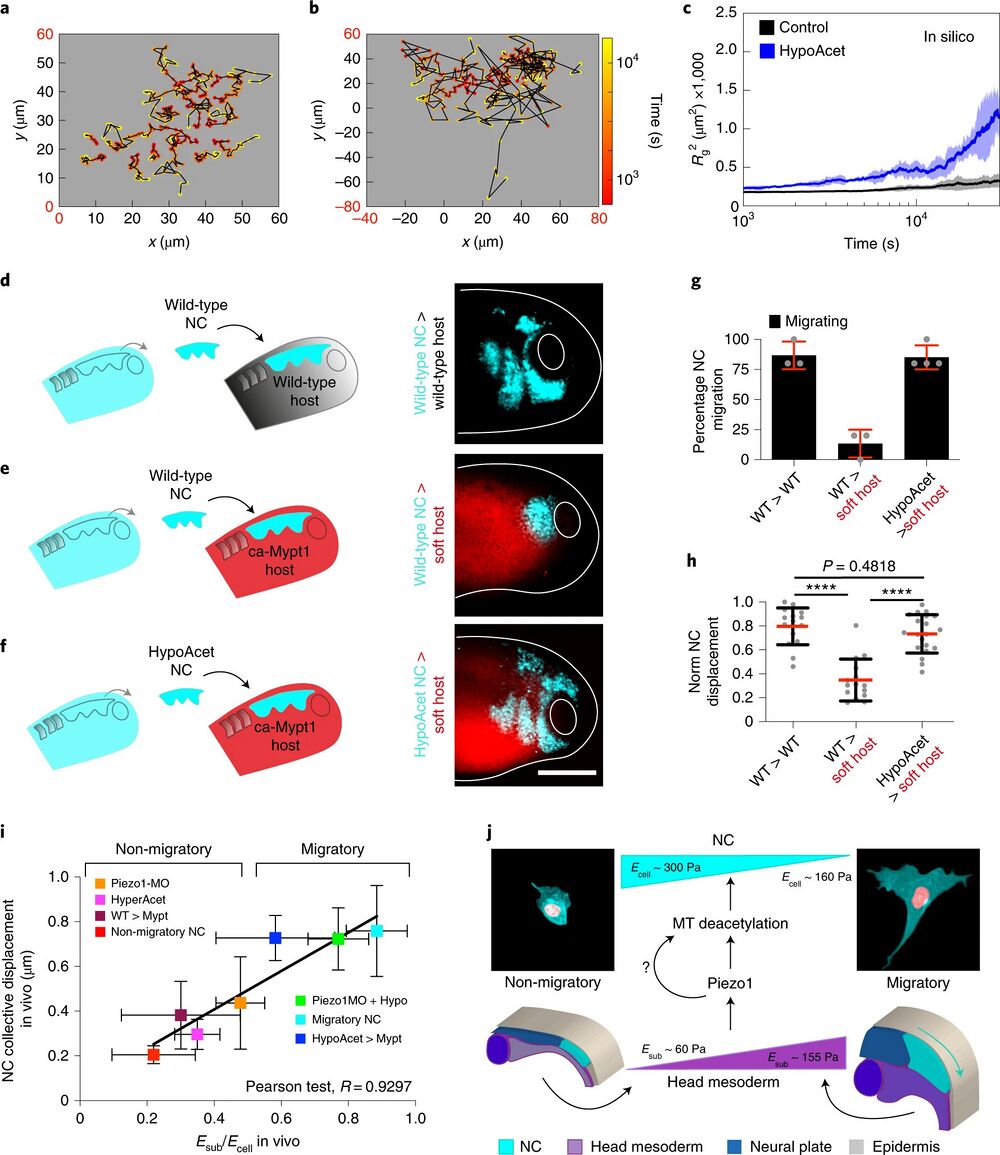
Fig. 6 | soft cell clusters migrate in compliant native environments. a–c, In silico results for the predicted behaviour of controls and hypoacetylated cells and clusters plated on soft substrates. a,b, Cell tracks depicting individual cell trajectories (note the differences in the x and y axes scales when comparing, highlighted in red): control (a) and HypoAcet (b). c, In silico Rg2 calculations showing collective cell behaviours under the indicated conditions: solid lines represent mean and shade the s.d. d–h, Graft experiments. d, Wild-type premigratory (stage 17.5) NC grafted into wild-type host embryos. e, Wild-type premigratory NC grafted into softened host embryos. f, Hypoacetylated premigratory NC grafted into softened hosts (scale bar, 200 μm). g, Percentage of embryos displaying NC migration; histograms represent mean and error bars s.d. h, Normalized displacement of NC along the dorso-ventral axis; red lines represent mean and whiskers s.d. (two-way ANOVA P < 0.0001; two-tailed t-test, ****P < 0.0001, CI = 95. In g and h, nwt into wt = 16, nwt into softened = 15, nhypoacetylated into softened = 20 embryos). Scale bar, 200 μm. d–f are representative examples from at least three independent experiments. i, Summary of the strong correlation we found between the cell-to-substrate stiffness ratio obtained from all our in vivo AFM measurements and the net displacement of NC along the embryo in under the same treatments (Pearson test, R = 0.9297). j, Schematic providing a mechanistic overview on how the mechano-molecular feedback loop that underly onset of CCM in vivo operates (detailed in Outlook).
Adapted with permission from Springer Nature on behalf of Nature Materials: Marchant et al. (2022). Cell clusters softening triggers collective cell migration in vivo. Nat Mater. 2022 Aug 15. doi: 10.1038/s41563-022-01323-0.
This work is licensed under a Creative Commons Attribution 4.0 International License. The images or other third party material in this article are included in the article’s Creative Commons license, unless indicated otherwise in the credit line; if the material is not included under the Creative Commons license, users will need to obtain permission from the license holder to reproduce the material. To view a copy of this license, visit http://creativecommons.org/licenses/by/4.0/
Last Updated: 2022-11-02