Adeno-associated viral tools trace neural development and connectivity across amphibians
Adeno-associated viral tools to trace neural development and connectivity across amphibians.
Dev Cell 2024 Nov 25; doi: 10.1016/j.devcel.2024.10.025.
Jaeger ECB, Vijatovic D, Deryckere A, Zorin N, Nguyen AL, Ivanian G, Woych J, Arnold RC, Gurrola AO, Shvartsman A, Barbieri F, Toma FA, Cline HT, Shay TF, Kelley DB, Yamaguchi A, Shein-Idelson M, Tosches MA, Sweeney LB.
Click here to view article at Developmental Cell.
Click here to view article on Pubmed.
Click here to view article on Xenbase.
Abstract
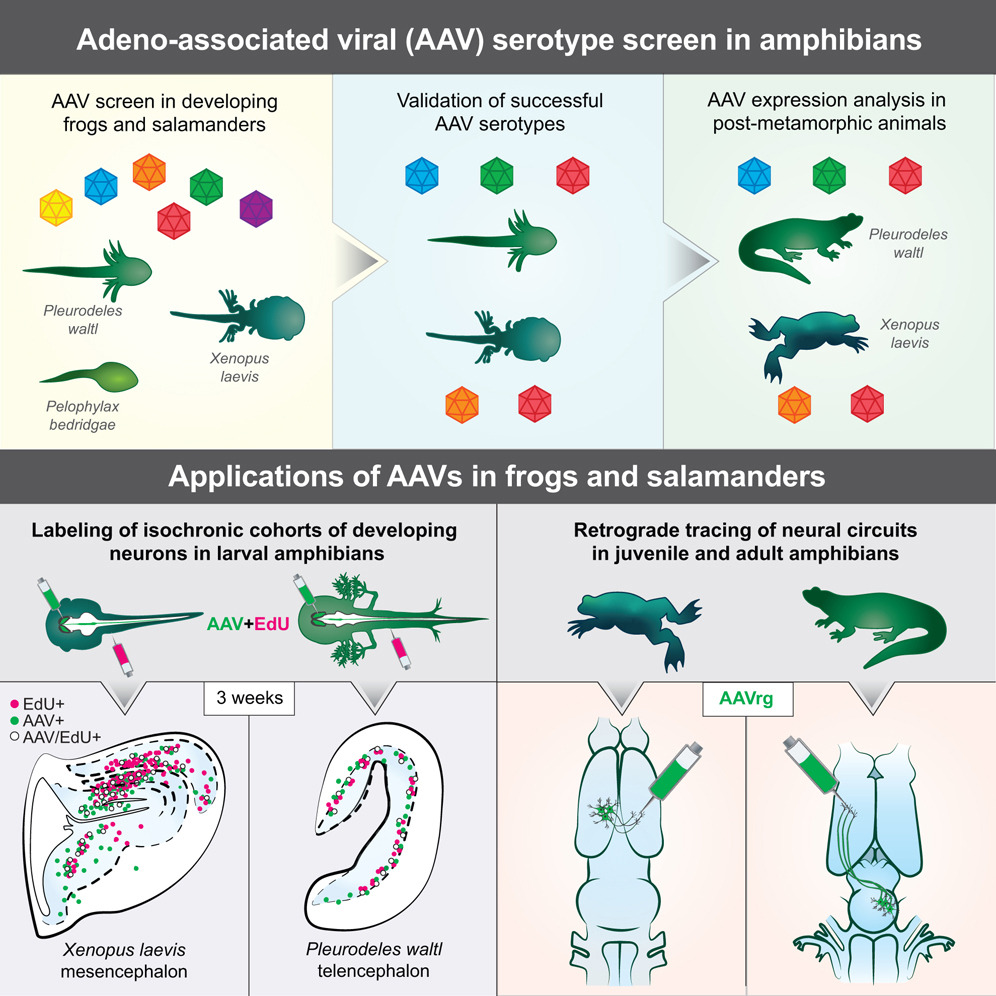
Amphibians, by virtue of their phylogenetic position, provide invaluable insights on nervous system evolution, development, and remodeling. The genetic toolkit for amphibians, however, remains limited. Recombinant adeno-associated viral vectors (AAVs) are a powerful alternative to transgenesis for labeling and manipulating neurons. Although successful in mammals, AAVs have never been shown to transduce amphibian cells efficiently. We screened AAVs in three amphibian species-the frogs Xenopus laevis and Pelophylax bedriagae and the salamander Pleurodeles waltl-and identified at least two AAV serotypes per species that transduce neurons. In developing amphibians, AAVs labeled groups of neurons generated at the same time during development. In the mature brain, AAVrg retrogradely traced long-range projections. Our study introduces AAVs as a tool for amphibian research, establishes a generalizable workflow for AAV screening in new species, and expands opportunities for cross-species comparisons of nervous system development, function, and evolution.
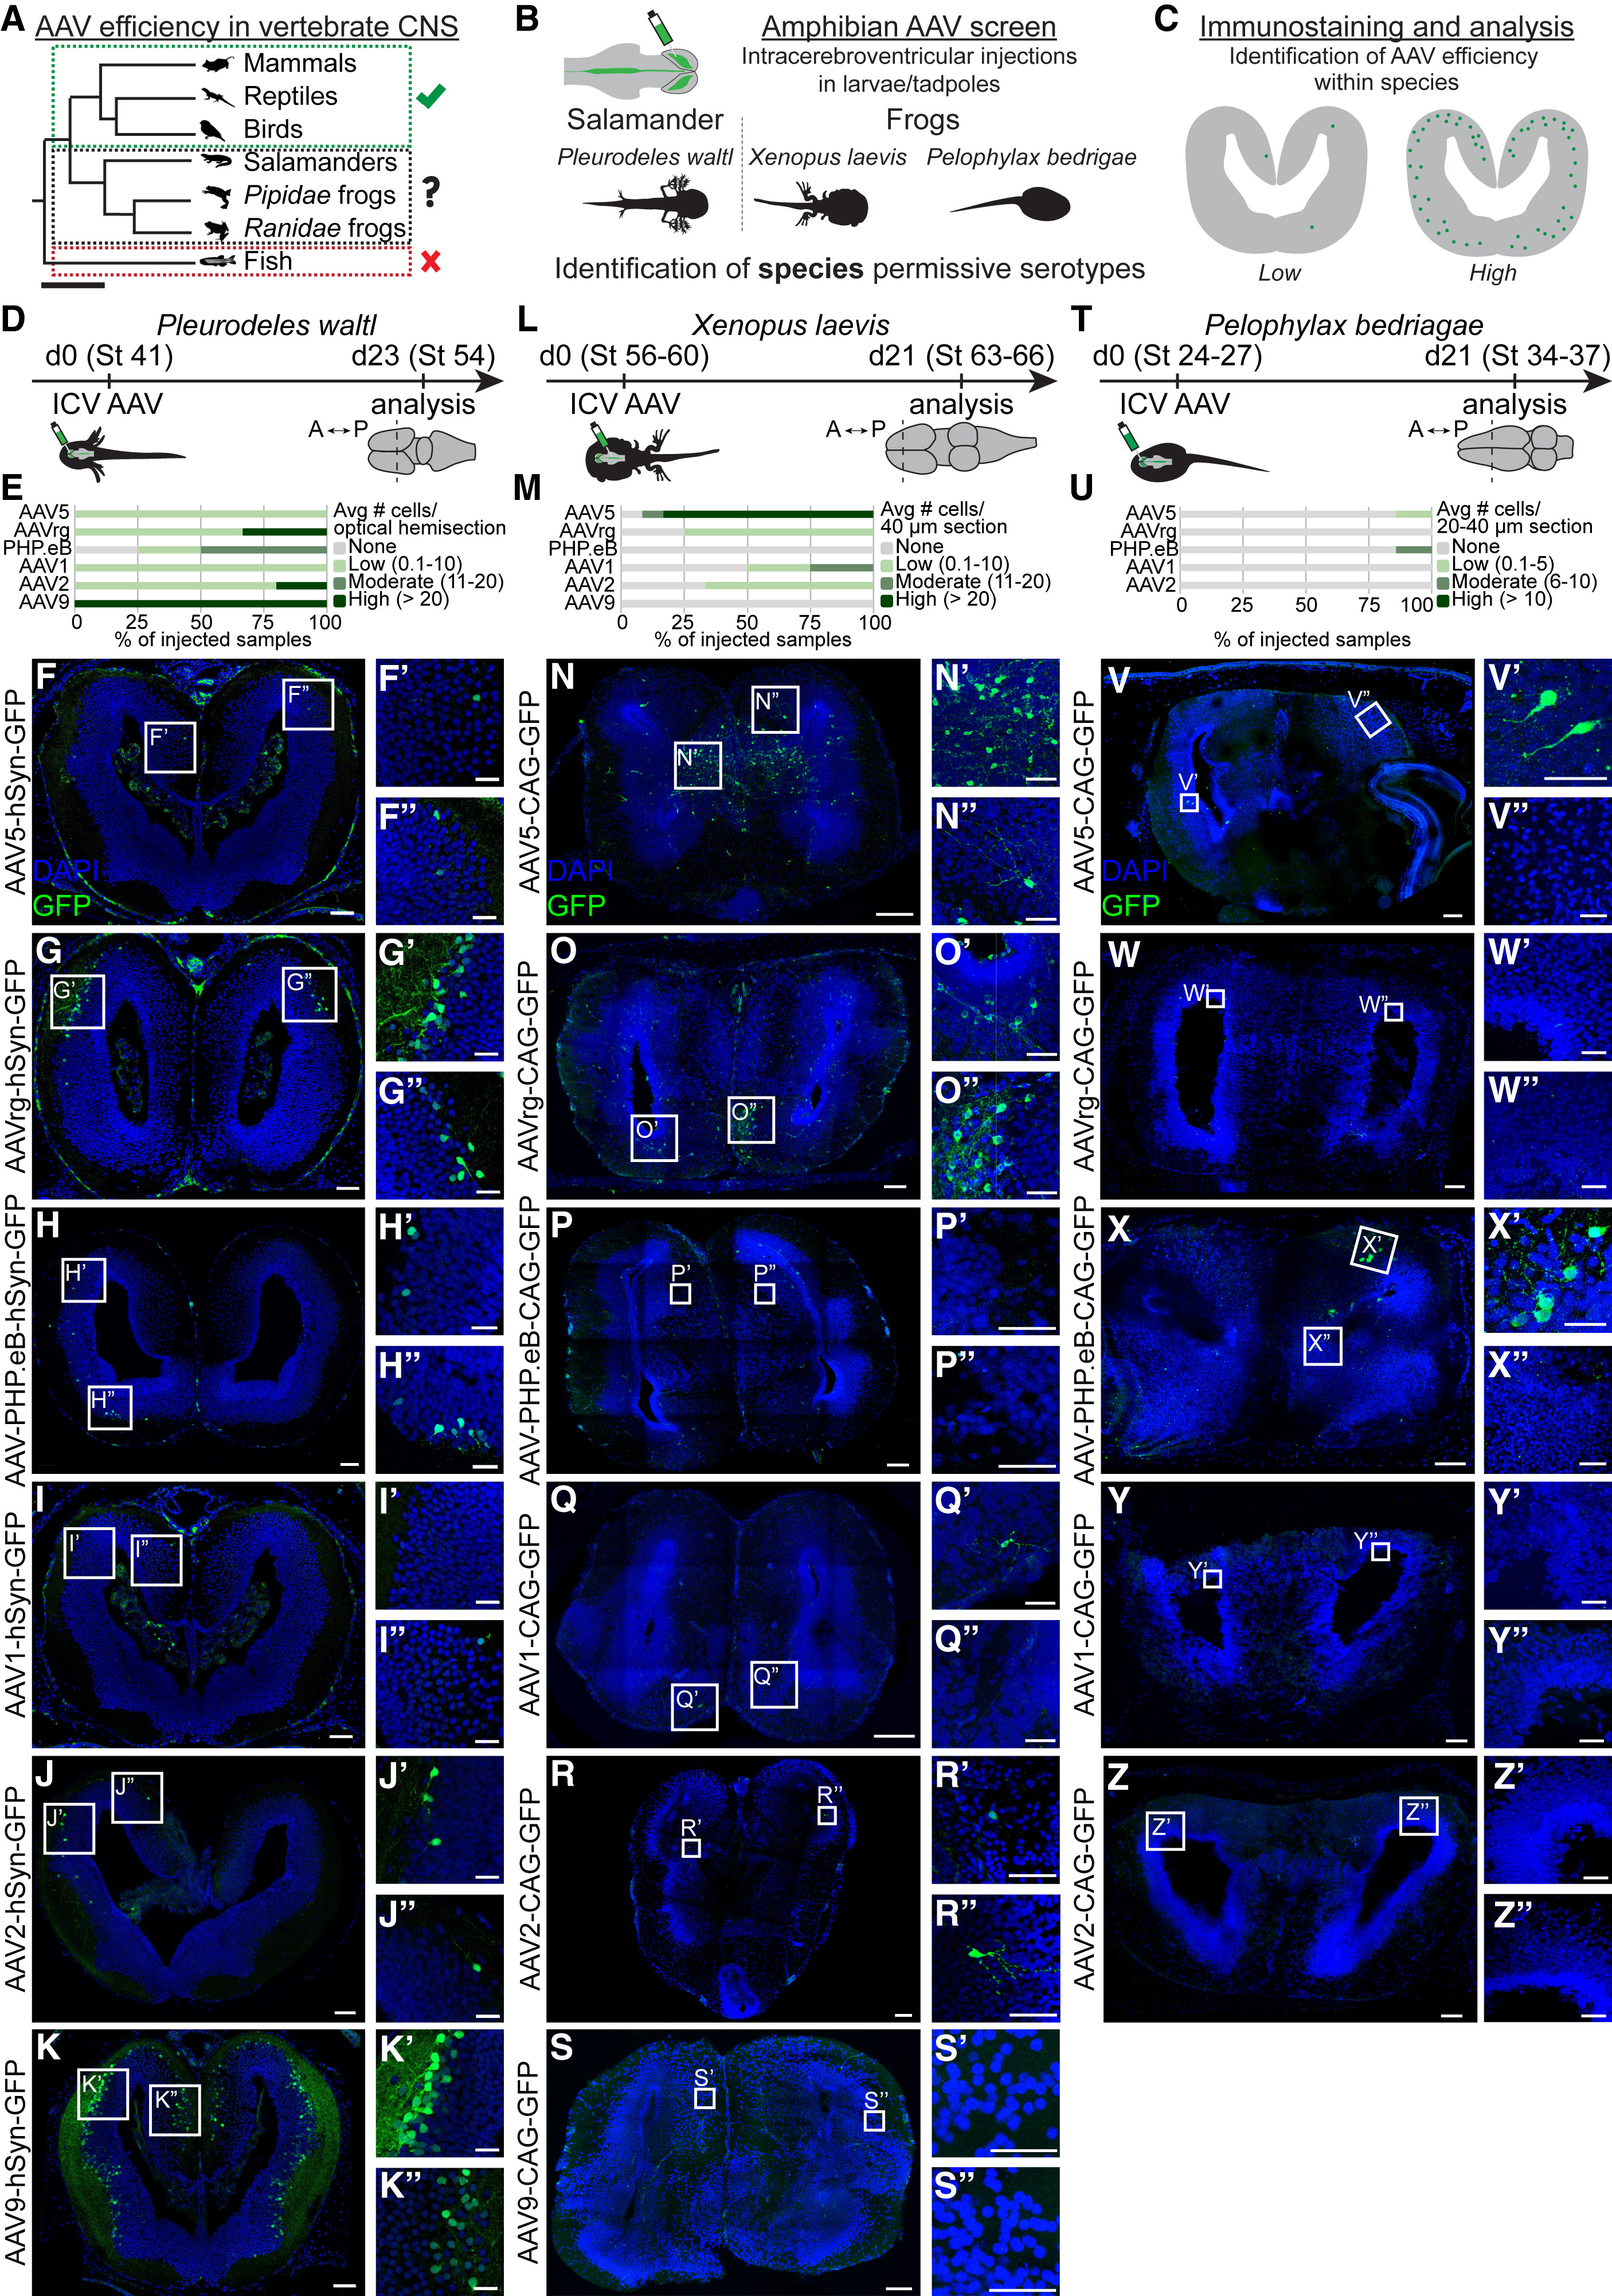
Figure 1. AAV serotype screen in Pleurodeles, Xenopus, and Pelophylax larvae (A) Overview of AAV use in vertebrates. Check marks indicate successful CNS transduction of any AAV serotype, “x” indicates no CNS transduction with tested serotypes, and “?” indicates the need for further investigation. Scale bar represents 200 million years ago. (B) Developing Pleurodeles, Xenopus, and Pelophylax were injected with a panel of AAV serotypes into the cerebral ventricle, enabling the identification of species-specific AAV expression patterns. (C) 3 weeks after intracerebroventricular injection, brains were sectioned, GFP signal amplified, and transduction efficiency analyzed (D–Z) and scored per species as either absent, low, moderate, or high in its average expression (see STAR Methods). (D–Z) For each serotype, left panels show representative overview images of coronal sections through the telencephalon, and right boxes indicate magnified regions. Scale bars in overview images and magnifications represent 100 and 40 μm, respectively. For each species, bar graphs represent the transduction efficiency of each serotype scored independently (E, M, and U). Abbreviations: ICV, intracerebroventricular; St, stage.
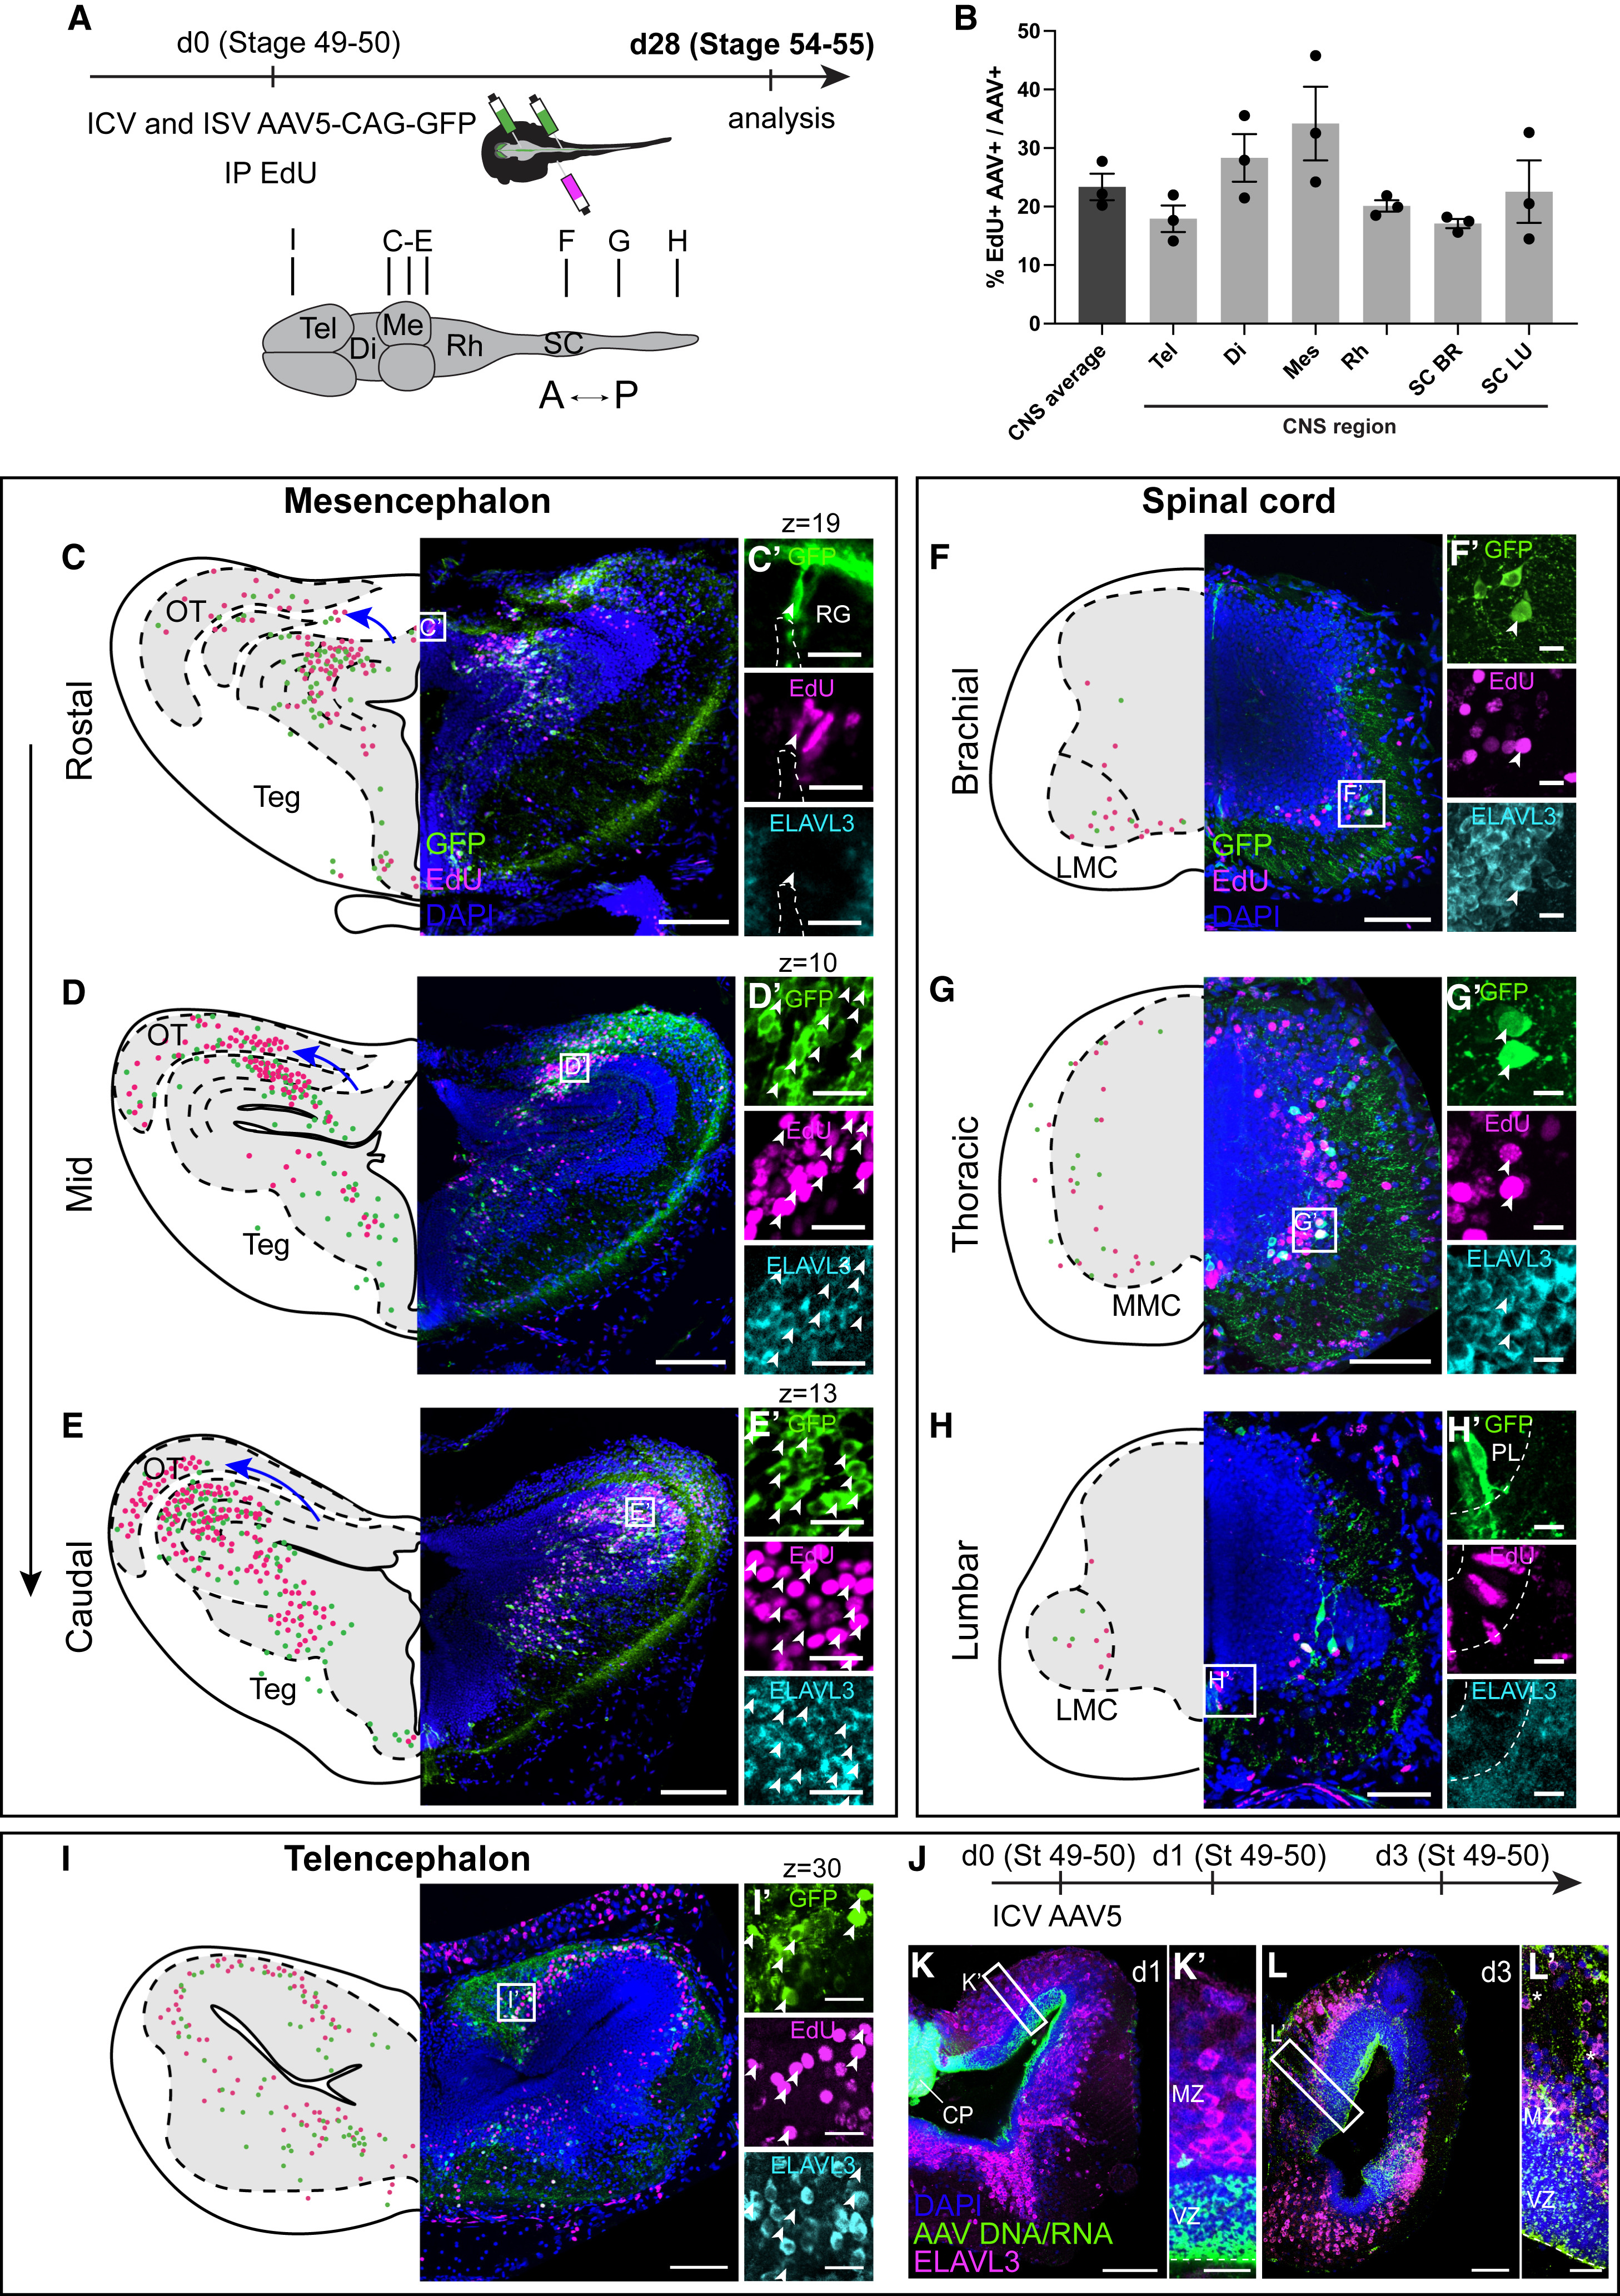
Figure 2. AAVs label distinct isochronic cohorts of neurons across the frog CNS (A) Intracerebro- and intraspinoventricular injections of AAV5-CAG-GFP coupled with intraperitoneal injections of EdU in prometamorphic NF 49–50 Xenopus tadpoles. GFP and EdU signals were detected 3 to 4 weeks after injection. (B) Quantification of percentage of EdU+ AAV-transduced cells across the CNS (mean ± SEM, n = 3 tadpoles, all p > 0.05, one-way ANOVA). (C–E) AAV and EdU signals overlap (white arrowheads) at the regional level at different rostral-caudal levels of the mesencephalon. Frog tectum expands medially and rostrally and then laterally and caudally (blue arrow). Transduced radial glia are GFP+ and EdU+ but not Elavl3+ (C′), whereas neurons are EdU+, GFP+, and Elavl3+ (D′ and E′). (F–H) In the spinal cord, AAV labeling captures the expansion of either LMC motor neurons at limb levels (F and H) or of interneurons and MMC motor neurons at the thoracic level (G). AAV labels both neurons (F′ and G′) and radial glia cells (H′), many of which are also EdU-positive (white arrowheads). (I) AAV and EdU signals in a coronal section through the telencephalon with many AAV+ EdU+ cells (white arrowheads). Scale bars in overview images and magnifications represent 400 and 20 μm in (C)–(E) and 100 and 20 μm in (F)–(I), respectively. Images show maximum intensity projections of 40 μm z stacks except in (C′), (D′), (E′), (I′), (K), (K′), (L), and (L′) where a single z-plane is shown due to the large amounts of labeling. (J–L) Prometamorphic tadpoles were injected intracerebroventricularly with AAV5-CAG-GFP and fixed 1 or 3 days after to inspect the viral DNA/RNA distribution using HCR. 1 day after injection (K), viral DNA/RNA was present in the CP and in the radial glia in the VZ but not in Elavl3+ neurons in the MZ (K′). 3 days after injection (L), the AAV DNA/RNA signal was present in the VZ and in radial glia processes (asterisks) (L′). Abbreviations: BR, brachial; CP, choroid plexus; Di, diencephalon; IP, intraperitoneal injection; ISV, intraspinoventricular injection; LMC, lateral motor column; LU, lumbar; Me, mesencephalon; MMC, medial motor column; MZ, mantle zone; OT, optic tectum; PL, progenitor layer; RG, radial glia; Rh, rhombencephalon; SC, spinal cord; Teg, tegmentum; Tel, telencephalon; VZ, ventricular zone; see also Figure 1.
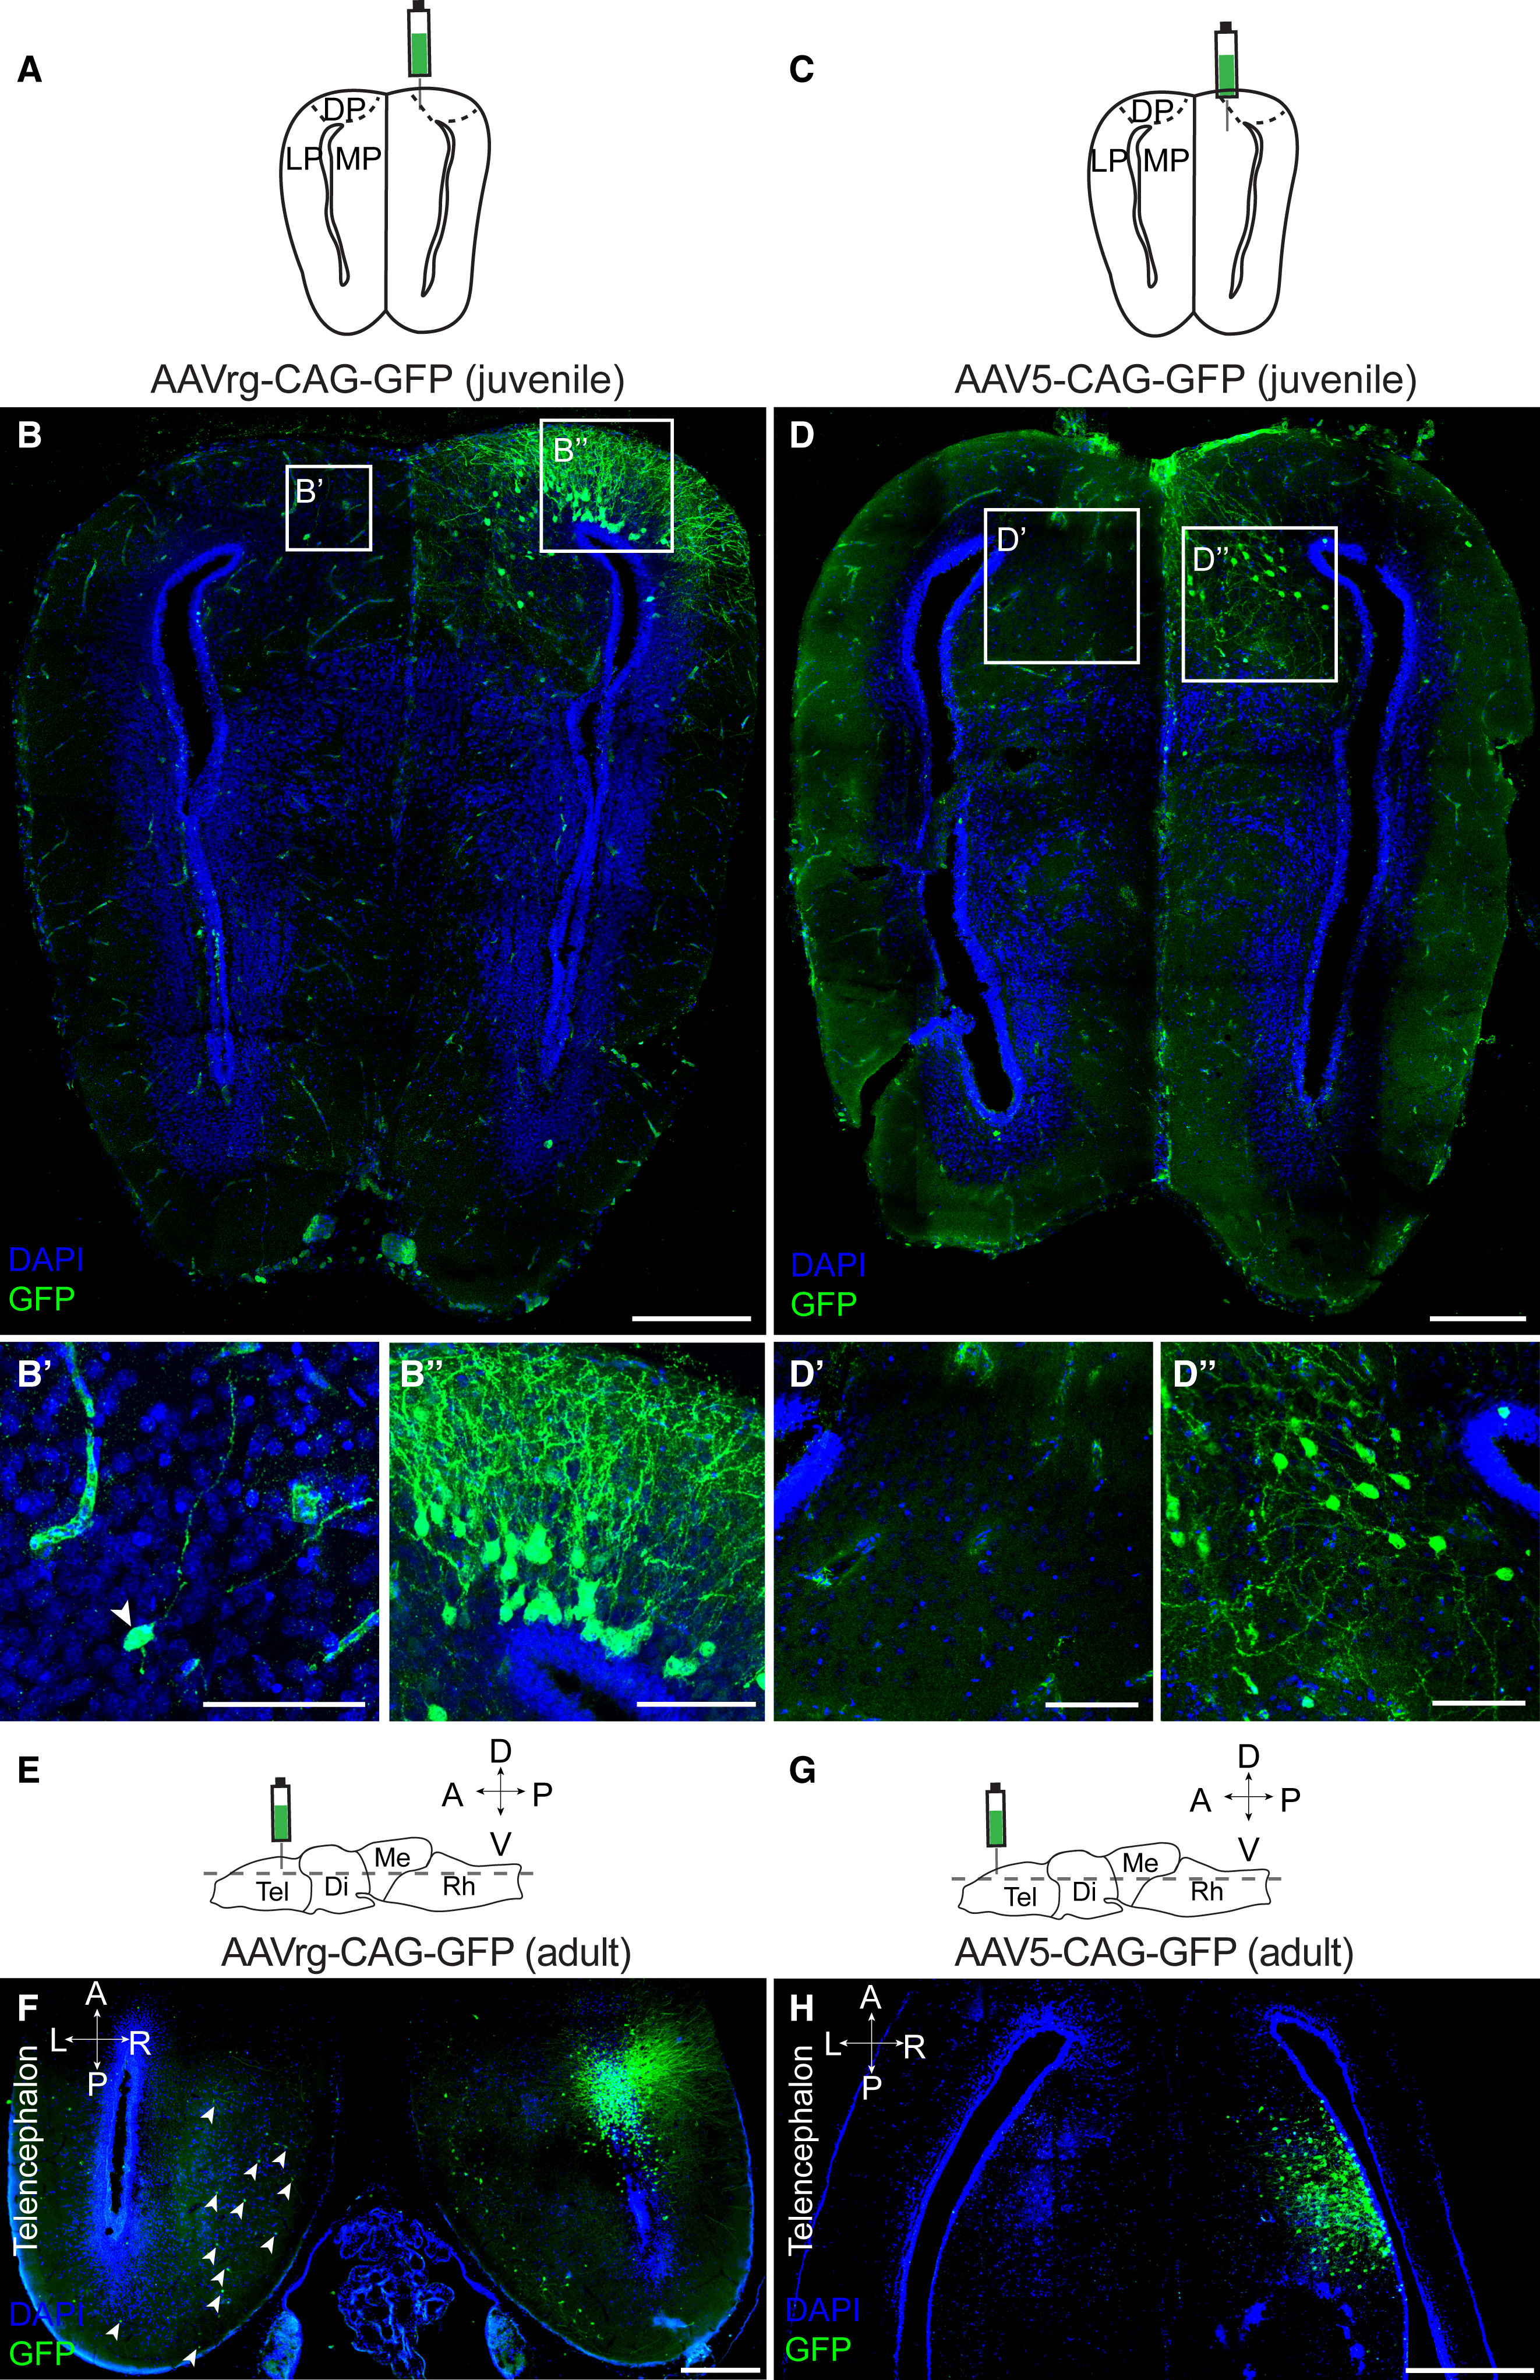
Figure 5. AAVrg and AAV5 transduce neurons in Xenopus juveniles and adults (A–D) Coronal section through the juvenile Xenopus telencephalon 3 weeks after AAVrg-CAG-GFP (A and B), or AAV5-CAG-GFP (C and D) direct injection into the medial-dorsal pallium, or medial pallium, respectively. AAVrg sparsely labeled neurons in the contralateral pallium (B′) and strongly labeled neurons in the ipsilateral pallium (B″). AAV5 labeled only ipsilateral neurons in juvenile frogs (D). (E–H) Horizontal sections through the adult Xenopus telencephalon 3 weeks after AAVrg-CAG-GFP (F) or AAV5-CAG-GFP (H) direct injection into the telencephalon. AAVrg labeled both ipsilateral and contralateral neurons (white arrows in F). AAV5 labeled only ipsilateral neurons (H). Scale bars in overview images and magnifications represent 400 and 50 μm, respectively. Abbreviations: DP, dorsal pallium; L, left; LP, lateral pallium; MP, medial pallium; see also Figures 1, 2, 3, and 4.
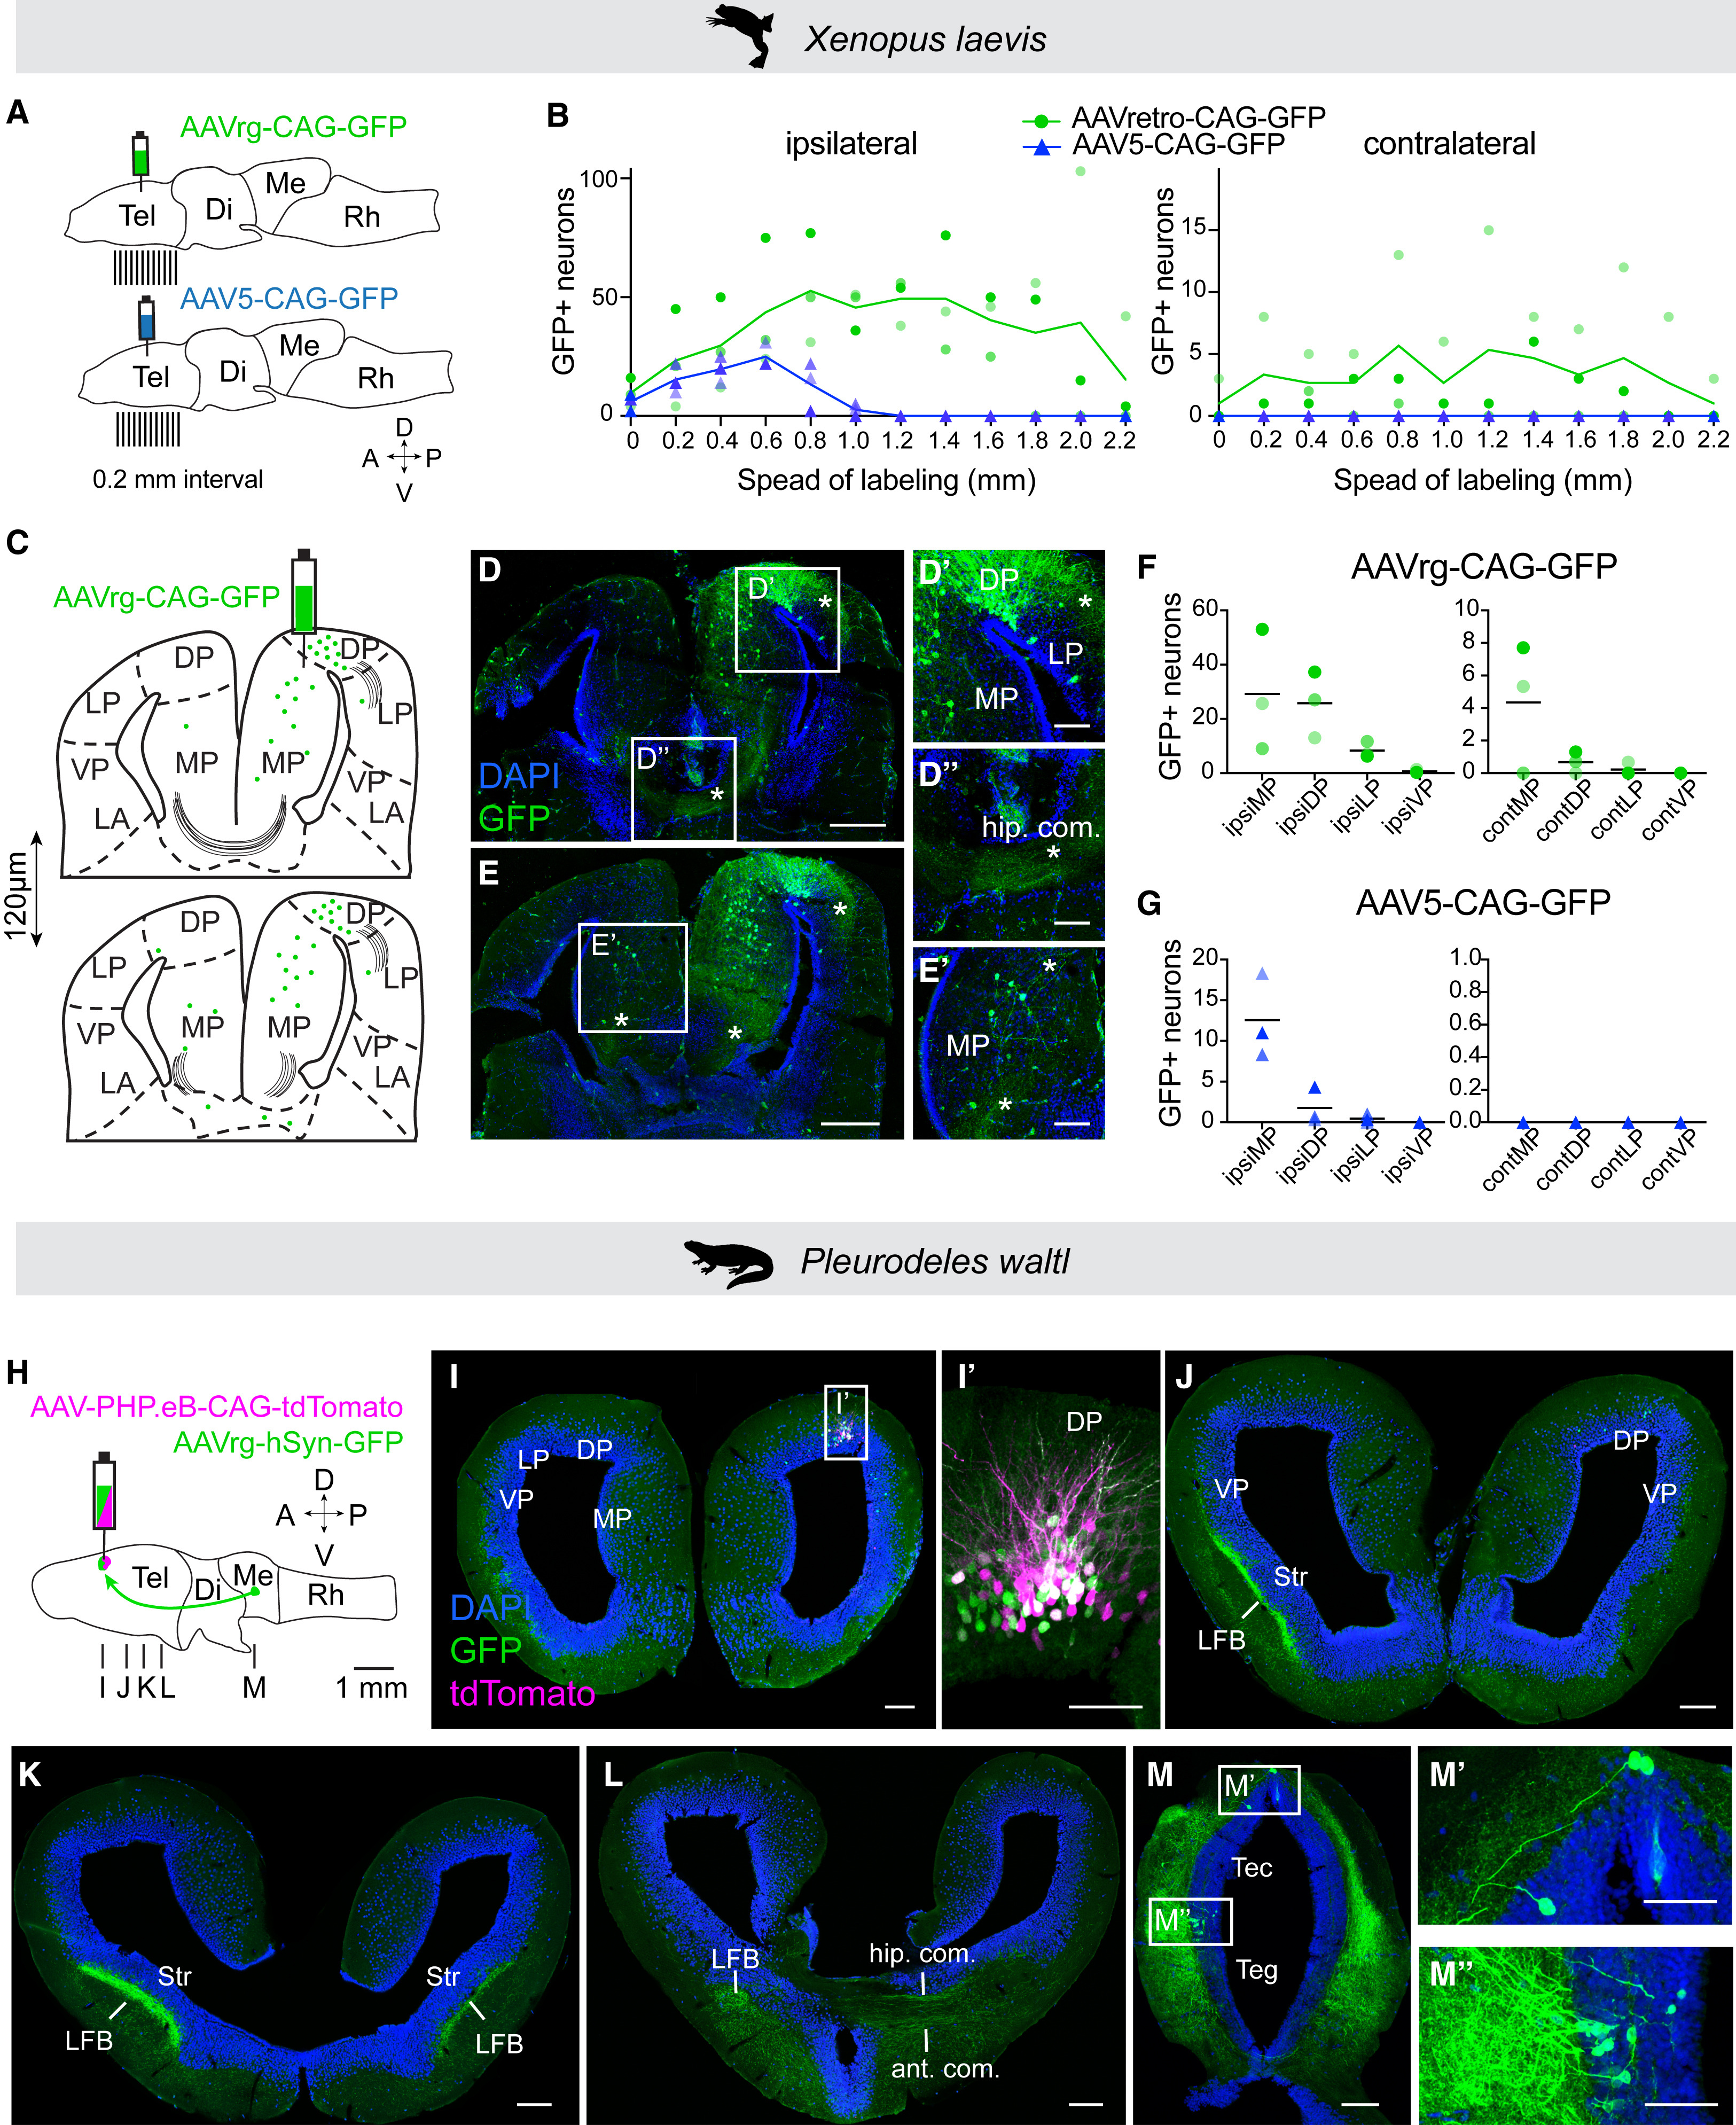
Figure 7. Retrograde tracing of neural circuits with AAVrg in Xenopus and Pleurodeles (A) Schematics showing injection sites and section planes for analysis of AAVrg-CAG-GFP and AAV5-CAG-GFP spread after injection into medial-dorsal pallium of juvenile Xenopus. (B) The numbers of labeled soma across the anteroposterior axis on the ipsilateral (left) and contralateral side (right) for AAVrg (green, n = 3) and AAV5 (blue, n = 3), and different color shades represent individual replicates. (C–E) Schematic of two coronal sections from the same brain, with labeled cells (green dots) and commissures (black lines) after injection of AAVrg-CAG-GFP into MP/DP (C), observed on coronal sections (D and E). Asterisks mark axons to the LP (D′), axonal tracts of the hippocampal commissure (D″), and traced axons in the contralateral MP (E′). (F and G) Quantification of GFP-positive cells in distinct telencephalic areas after injection of AAVrg-CAG-GFP (F) or AAV5-CAG-GFP (G), and each dot represents an animal marked by a different shade of green (AAVrg) or blue (AAV5). Contralateral labeling was compared between AAV5 and AAVrg for each region (mean, n = 3 juveniles, Kruskal-Wallis followed by a Dunn’s multiple comparison test: p = 0.08, 0.18, and >0.999 for contMP, contDP, and contLP, respectively). For Xenopus, scale bars in overview image and magnifications represent 400 and 50 μm, respectively. For an additional example, see Figure S5. (H) Schematic showing injection site and section planes for the co-injection of AAV-PHP.eB-CAG-tdTomato and AAVrg-hSyn-GFP in the DP of a post-metamorphic Pleurodeles. Arrow indicates axonal projections to DP from the midbrain. (I) Coronal section showing both tdTomato and GFP labeling at the injection site. (I′) Maximum intensity projection of a 25 μm stack of 5 images taken at 5 μm intervals at the injection site. (J–L) Representative coronal sections along the anterior-posterior axis showing GFP expression far from the injection site, including strong axonal expression in the LFB and commissures. (M) Retrogradely labeled soma in the midbrain, in both tectum and tegmentum, approx. 4 mm away from the injection site. For Pleurodeles, scale bars in overview images and magnifications represent 200 and 100 μm. For additional examples (n = 4 total), see Figure S6. Abbreviations: ant. com., anterior commissure; APOA, anterior preoptic area; CeA, central amygdala; cont, contralateral; hip. com, hippocampal commissure; ipsi, ipsilateral; LA, lateral amygdala; LFB, lateral forebrain bundle; Sept, septum; Str, striatal neuropil; Tec, tectum; see also Figures 1, 2, 3, 4, 5, and 6.
Adapted with permission from AAAS on behalf of Science Advances: Jaeger et al. (2024). Adeno-associated viral tools to trace neural development and connectivity across amphibians. Dev Cell 2024 Nov 25; doi: 10.1016/j.devcel.2024.10.025.
This work is licensed under a Creative Commons Attribution 4.0 International License. The images or other third party material in this article are included in the article’s Creative Commons license, unless indicated otherwise in the credit line; if the material is not included under the Creative Commons license, users will need to obtain permission from the license holder to reproduce the material. To view a copy of this license, visit http://creativecommons.org/licenses/by/4.0/
Last Updated: 2024-12-17