XB-IMG-87039
Xenbase Image ID: 87039
|
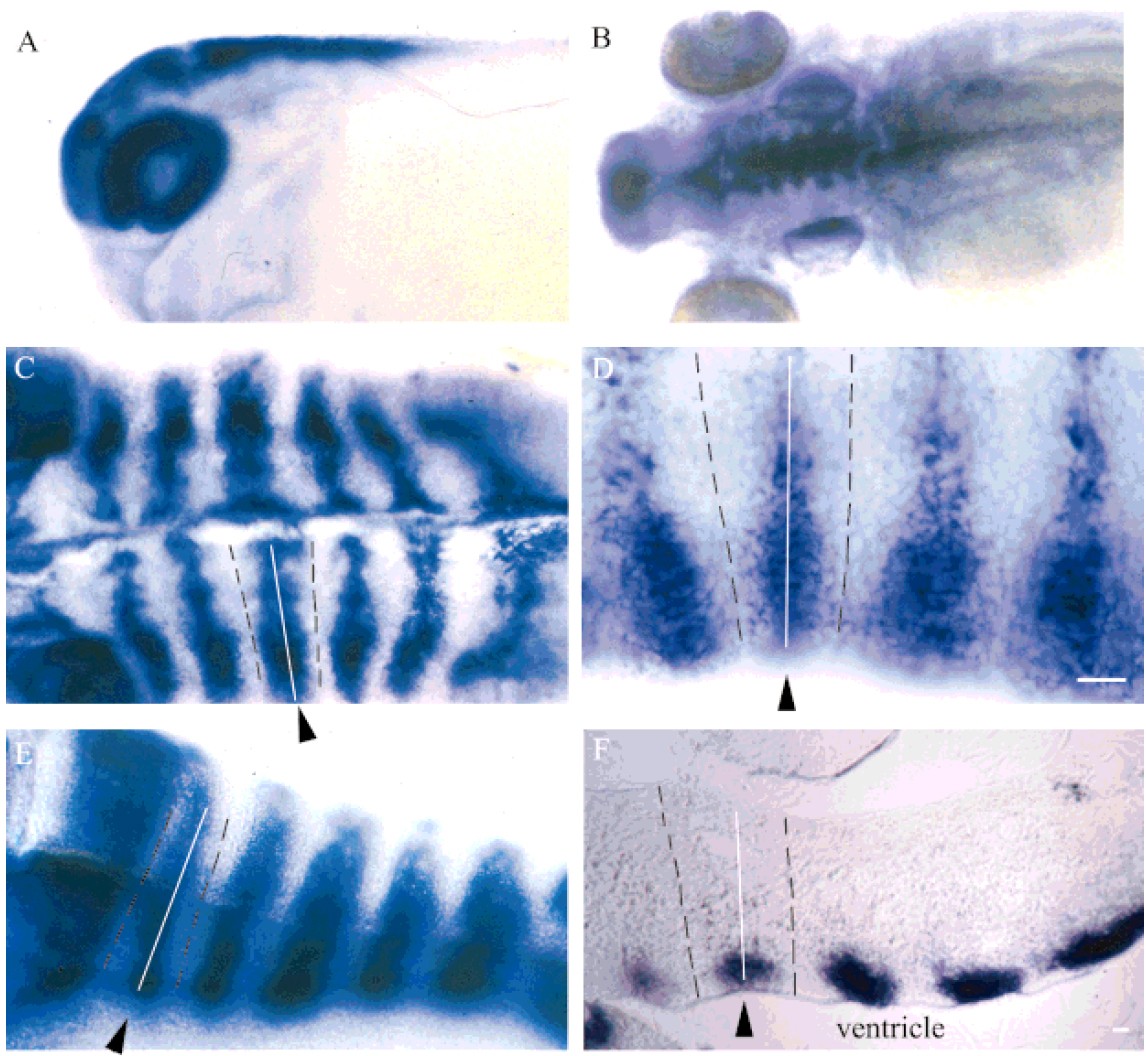
Fig. 2. DMg transcript distribution by in situ hybridization.A: Stage 29/30 embryo. DMg transcripts are seen in the eyes, forebrain, and hindbrain. DMg signal is uniformly distributed in the hindbrain. B,C: Stage 42/43 tadpole and isolated brain. DMg transcripts appear to be segmentally distributed in the center of each rhombomere. D: Nomarsky optics of the stage 42/43 isolated brain.E: At stage 54/55, DMg transcripts are detected segmentally in the center of each rhombomere as they are at stage 42/43. F: Transverse section shows the DMg localization at the rhombomere centers. White lines and black arrowheads indicate center regions, black dotted lines indicate boundary regions. Scale bars 5 20mm in D,F. Image published in: Yoshida M and Colman DR (2000) Copyright © 2000. Image reproduced with permission of the Publisher.
Image source: Published Larger Image Printer Friendly View |