Oocytes maintain ROS-free mitochondrial metabolism by suppressing complex I
Aida Rodríguez-Nuevo, Ariadna Torres-Sanchez, Juan M. Duran, Cristian De Guirior, Maria Angeles Martínez-Zamora & Elvan Böke
Nature. 2022 Jul;607(7920):756-761. doi: 10.1038/s41586-022-04979-5. Epub 2022 Jul 20.
Click here to view article at Nature.
Click here to vie article on Pubmed.
Click here to view article at Xenbase.
Abstract
Oocytes form before birth and remain viable for several decades before fertilization1. Although poor oocyte quality accounts for most female fertility problems, little is known about how oocytes maintain cellular fitness, or why their quality eventually declines with age2. Reactive oxygen species (ROS) produced as by-products of mitochondrial activity are associated with lower rates of fertilization and embryo survival. Yet, how healthy oocytes balance essential mitochondrial activity with the production of ROS is unknown. Here we show that oocytes evade ROS by remodelling the mitochondrial electron transport chain through elimination of complex I. Combining live-cell imaging and proteomics in human and Xenopus oocytes, we find that early oocytes exhibit greatly reduced levels of complex I. This is accompanied by a highly active mitochondrial unfolded protein response, which is indicative of an imbalanced electron transport chain. Biochemical and functional assays confirm that complex I is neither assembled nor active in early oocytes. Thus, we report a physiological cell type without complex I in animals. Our findings also clarify why patients with complex-I-related hereditary mitochondrial diseases do not experience subfertility. Complex I suppression represents an evolutionarily conserved strategy that allows longevity while maintaining biological activity in long-lived oocytes.
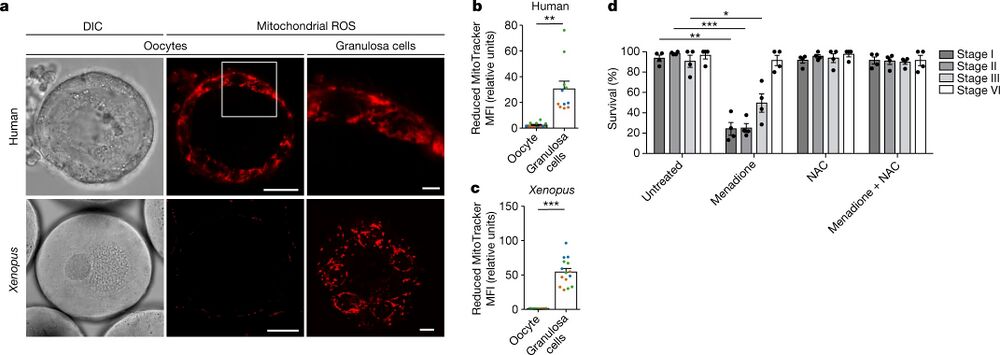
Fig. 1: Early oocytes have undetectable levels of ROS. a, Live-cell imaging of human and Xenopus early oocytes, both with attached granulosa cells. The ROS level was measured using MitoTracker Red CM-H2XRos (H2X), a reduced mitochondrial dye that does not fluoresce until it is oxidized by ROS. The boxed area is magnified in the top right image. Xenopus granulosa cells were imaged at the basal plane of the oocyte. DIC, differential interference contrast. Scale bars, 15 µm (human oocytes), 50 µm (Xenopus oocytes), 3 µm (human granulosa cells) and 10 µm (Xenopus granulosa cells). b,c, Quantification of the mean fluorescence intensity (MFI) of H2X in the oocyte and in the population of granulosa cells surrounding the equatorial plane of the oocyte for human (b) and Xenopus (c) oocytes. The data represent the mean ± s.e.m. of three biological replicates, shown in different colours. **P = 0.0001 and ***P = 4.13 × 10⁻¹¹ using a two-sided Student’s t-test. d, Overnight survival of oocytes at the indicated stages of oogenesis after treatment with menadione, N-acetyl cysteine (NAC) or the combination of both (see Extended Data Fig. 1j for experimental design). At least ten oocytes were incubated per condition. The data represent the mean ± s.e.m. across four biological replicates. *P = 1.94 × 10⁻⁹, **P = 3.77 × 10⁻¹⁸ and ***P = 2.37 × 10⁻¹⁹ compared with the untreated condition using a two-sided Student’s t-test with Šidák–Bonferroni-adjusted P values for multiple comparisons.
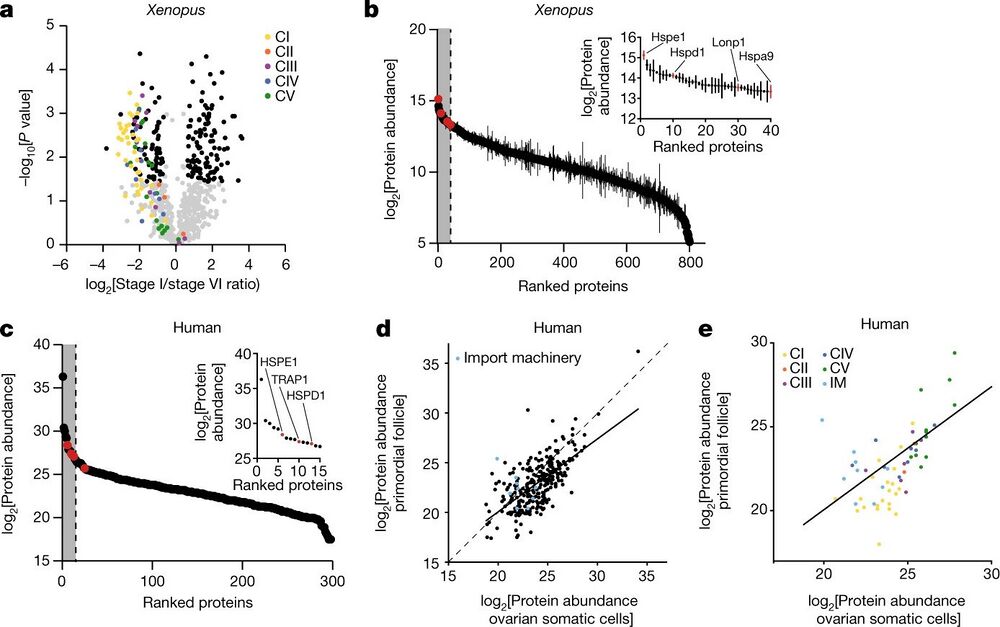
Fig. 3: The mitochondrial proteomes of Xenopus and human oocytes. a, A volcano plot showing P values versus fold changes of mitochondrial proteins between early (stage I) and late (stage VI) oocytes. The subunits of the mitochondrial OXPHOS machinery are indicated in colour, according to the key in the plot. Other mitochondrial proteins significantly changing (q value < 0.05, >1.5-fold change) are depicted in black. n = 3 outbred animals, P values were calculated using two-sided Student’s t-test, and q values were obtained by multiple-comparison adjustment. b, The early Xenopus oocyte proteome ranked by protein abundance. The inset shows data for the top 5% most abundant proteins, corresponding to the grey area of the graph. UPRmt proteins are indicated in red. The data are the mean ± s.e.m. from n = 3 outbred animals. c, The human primordial follicle proteome ranked by protein abundance. The inset shows data for the top 5% most abundant proteins, corresponding to the grey area of the graph. Oocytes were collected from ovaries of two patients and pooled together. UPRmt proteins are indicated in red. d,e, Scatter plots comparing mitochondrial (d) and OXPHOS (e) protein abundance in human primordial follicles and ovarian somatic cells. The dashed line represents the identity line x = y and the solid line shows the linear regression estimate relating protein abundance between mitochondrial proteomes of primordial follicles and ovarian somatic cells. IM, import machinery.

Fig. 5: Complex I and ROS levels correlate throughout oogenesis. a, Mitochondrial fractions from early (stage I), maturing (stage II and stage III) and late-stage (stage VI) Xenopus oocytes and muscle solubilized in n-dodecyl-β-D-maltoside (DDM) were resolved by BN-PAGE and complex I activity was assayed. One representative gel from three independent experiments is shown. CS, citrate synthase. b, Overnight survival of early (stage I), maturing (stage II and III) and late-stage (stage VI) Xenopus oocytes after treatment with the complex I inhibitor rotenone (5 µM). At least 10 oocytes were incubated per condition. The data represent the mean ± s.e.m.; n = 3 biological replicates. *P = 0.0028 and **P = 0.0002 using two-sided Student’s t-test with Šidák–Bonferroni-adjusted P values for multiple comparisons. c, Prdx3 dimer/monomer ratio assessed in oocytes in the indicated stages of oogenesis. The data represent the mean ± s.e.m; n = 4 biological replicates. NS, not significant (P = 0.1128), *P = 0.0376 and **P = 0.0164 using two-sided Student’s t-test with Šidák–Bonferroni-adjusted P values for multiple comparisons.
Adapted with permission from Springer Nature on behalf of Nature: Rodríguez-Nuevo et al. (2022). Oocytes maintain ROS-free mitochondrial metabolism by suppressing complex I. Nature. 2022 Jul;607(7920):756-761. doi: 10.1038/s41586-022-04979-5. Epub 2022 Jul 20.
This work is licensed under a Creative Commons Attribution 4.0 International License. The images or other third party material in this article are included in the article’s Creative Commons license, unless indicated otherwise in the credit line; if the material is not included under the Creative Commons license, users will need to obtain permission from the license holder to reproduce the material. To view a copy of this license, visit http://creativecommons.org/licenses/by/4.0/
Last Updated: 2022-08-17