ARVCF catenin controls force production during vertebrate convergent extension
Robert J Huebner, Shinuo Weng, Chanjae Lee, Sena Sarıkaya, Ophelia Papoulas, Rachael M Cox, Edward M Marcotte, John B Wallingford
Dev Cell. 2022 Apr 20;S1534-5807(22)00241-6. doi: 10.1016/j.devcel.2022.04.001. Online ahead of print.
Click here to view article at Developmental Cell.
Click here to view article on Pubmed.
Highlights
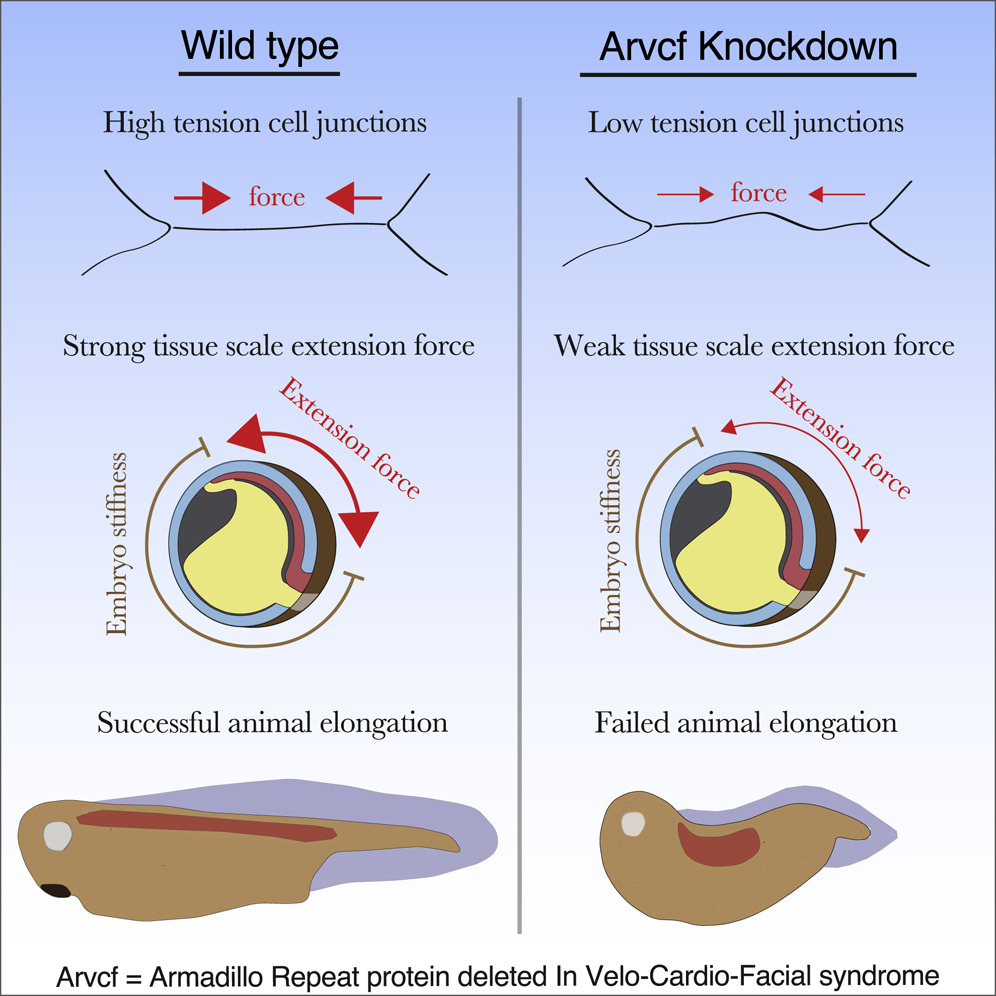
• Arvcf catenin is required for high tension at cell-cell junctions
• Low tension at cell junctions results in a tissue-scale defect in force production
• A modest reduction in tissue-scale force disrupts vertebrate head-to-tail axis extension
In Brief
Huebner and Weng et al. identify a poorly characterized catenin, Arvcf, as a regulator of force production during vertebrate head-to-tail axis extension. This work gives a detailed characterization of Arvcf and provides an insight into how cell- and tissue-scale biomechanics control embryo development.
Summary
The design of an animal’s body plan is encoded in the genome, and the execution of this program is a mechanical progression involving coordinated movement of proteins, cells, and whole tissues. Thus, a challenge to understanding morphogenesis is connecting events that occur across various length scales. Here, we describe how a poorly characterized adhesion effector, Arvcf catenin, controls Xenopus head-to-tail axis extension. We find that Arvcf is required for axis extension within the intact organism but not within isolated tissues. We show that the organism-scale phenotype results from a defect in tissue-scale force production. Finally, we determine that the force defect results from the dampening of the pulsatile recruitment of cell adhesion and cytoskeletal proteins to membranes. These results provide a comprehensive understanding of Arvcf function during axis extension and produce an insight into how a cellular-scale defect in adhesion results in an organism-scale failure of development.
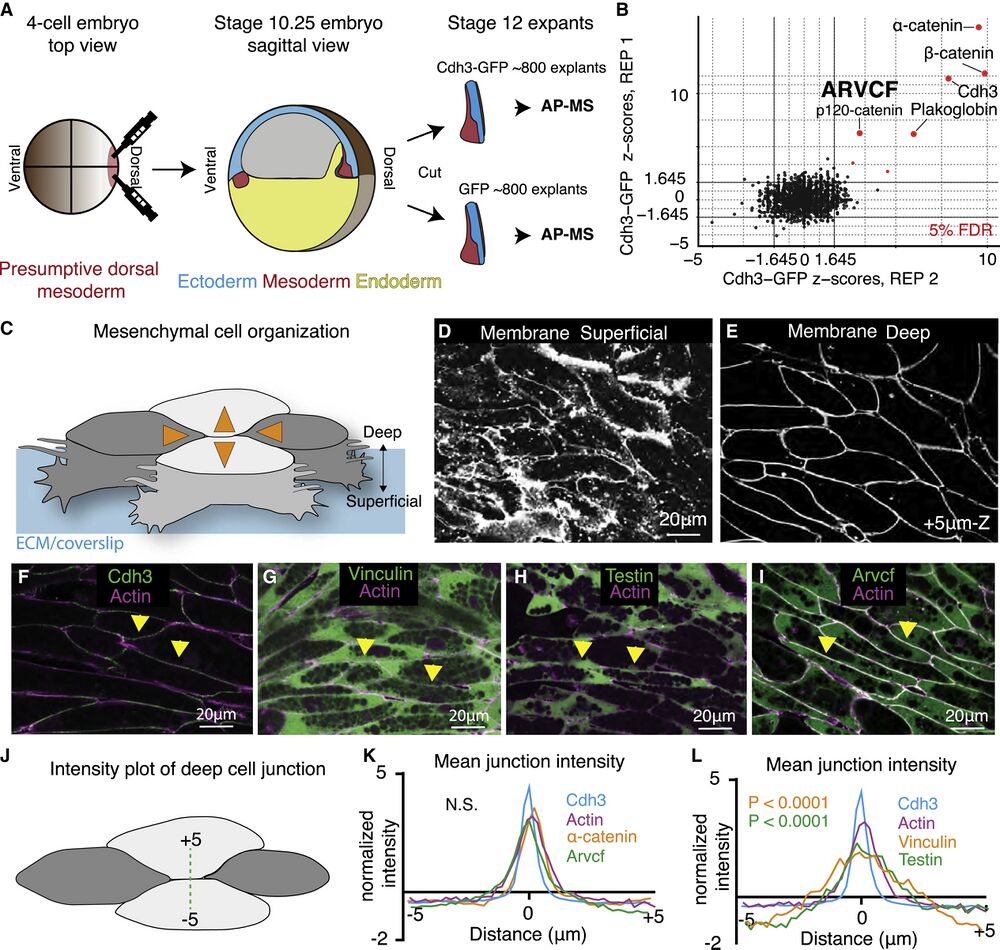
Figure 1. Tissue- and stage-specific Cdh3 affinity purification mass spectrometry results in a highly specific Cdh3 protein interaction dataset
(A) Schematic depicting the method used for tissue- and stage-specific affinity purification mass spectrometry (AP-MS) of Cdh3.
(B) Graph showing the relative protein orthogroup enrichment (see methods) from two replicates of the Cdh3 AP-MS experiment. Here, we plot the Z scores from replicate 1 on the y axis and the Z scores from replicate 2 on the x axis. Each dot represents a protein identified in the Cdh3 AP-MS dataset and red dots represent proteins that fall below a 5% FDR threshold.
(C) Cartoon depicting Xenopus mesenchymal cells during convergent extension. Here, the mediolateral cells, dark gray, move to each other resulting in displacement of the anterior-posterior cells, light gray. Orange arrows show the cell movements. Mesenchymal cells display apparent structural differences along the superficial (cell-ECM interface) to deep (cell-cell interface) axis. Here, polarized lamellar-like structures are observed at the superficial surface. Movement deeper into the cell reveals cell-cell interfaces and actin-based protrusions that extend between neighboring cells.
(D) Image of the superficial surface of converging and extending Xenopus mesenchymal cells. Cells are labeled with a membrane marker that primarily shows lamellar-like protrusions at the cell-ECM interface.
(E) Image of the deep surface of the same cells shown in Figure 1D. Here, the membrane marker largely highlights the cell-cell junctions.
(F) Image of Cdh3 (green) and actin (magenta) at deep cell-cell contacts. Protein localization was visualized by expressing tagged fusion proteins. Yellow arrowheads point to cell junctions.
(G) Image of vinculin (green) and actin (magenta) at deep cell structures. Protein localization was visualized by expressing tagged fusion proteins. Yellow arrowheads point to cell junctions.
(H) Image of testin (green) and actin (magenta) at deep cell-cell junctions. Protein localization was visualized by expressing tagged fusion proteins. Yellow arrowheads point to cell junctions.
(I) Image of the Arvcf (green) and actin (magenta) at deep cell-cell junctions. Protein localization was visualized by expressing tagged fusion proteins. Yellow arrowheads point to cell junctions.
(J) Schematic displaying the method used to measure fluorescent intensities at cell-cell interfaces.
(K) Intensity plots of Cdh3 (blue), actin (magenta), α-catenin (orange), and Arvcf (green). Here, zero is set at the center of the cell-cell junction, and each protein shows a clear peak at the cell junction. Each line is the average over dozens of line plots from a minimum of three replicates. Distributions were statistically compared using a KS test.
(L) Intensity plots of Cdh3 (blue), actin (magenta), vinculin (orange), and testin (green) at cell-cell junctions. Vinculin and testin lack peaks at the cell-cell junction, and the distributions of vinculin and testin were statistically different from Cdh3 and actin as compared by a KS test. Each line represents the average of dozens of line plots over a minimum of three replicates.

Figure 2. Arvcf is required for embryonic axis extension
(A) Wild-type tadpoles (∼st.40).
(B) Sibling embryos to those shown in Figure 2A in which Arvcf was knocked down in the dorsal mesodermal cells. The Arvcf-depleted embryos have a shortened head-to-tail axis and display a characteristic dorsal bend suggesting a CE defect.
(C) Sibling embryos in which Arvcf was knocked down and then rescued with exogenous expression of Arvcf-GFP.
(D) Plot showing tadpole (∼st.40) head-to-tail length for the wild type, ARVCF knockdown, and Arvcf rescue conditions. Embryo lengths were statistically compared using an ANOVA test. Each dot represents a single embryo, and data were collected from a minimum of three experiments.
(E) Stage 11.5 wild-type embryos stained by in situ hybridization for the notochord probe Xnot. (E′) Stage 14 wild-type embryos stained by in situ hybridization for the notochord probe Xnot.
(F) Stage 11.5 Arvcf knockdown embryos stained by in situ hybridization for the notochord probe Xnot. (F′) Stage 14 Arvcf knockdown embryos stained by in situ hybridization for the notochord prob Xnot.
(G) Comparison of the total notochord length in wild-type or Arvcf knockdown embryos at stage 11.5 and stage 14. Conditions were statistically compared using a Mann-Whitney test.
(H) Comparison of the notochord width for wild-type or Arvcf knockdown embryos at stage 11.5 and stage 14. Conditions were statically compared using a Mann-Whitney test.
(I) Cartoon depicting the microinjection method used to generate mosaic animals.
(J) Immunostaining for Arvcf (orange) in an embryo in which Arvcf has been mosaically knocked down (blue cells).
(K) The same image shown in Figure 2J except the membrane marker has been removed to better visualize the Arvcf immunostaining.
(L) Quantification of endogenous Arvcf protein levels from the immunostaining performed on embryos with mosaic Arvcf knockdown. Each dot represents the average ARVCF intensity at the membrane of a single cell, and data were collected from a minimum of three replicates. Conditions were statistically compared using a Mann-Whitney test.
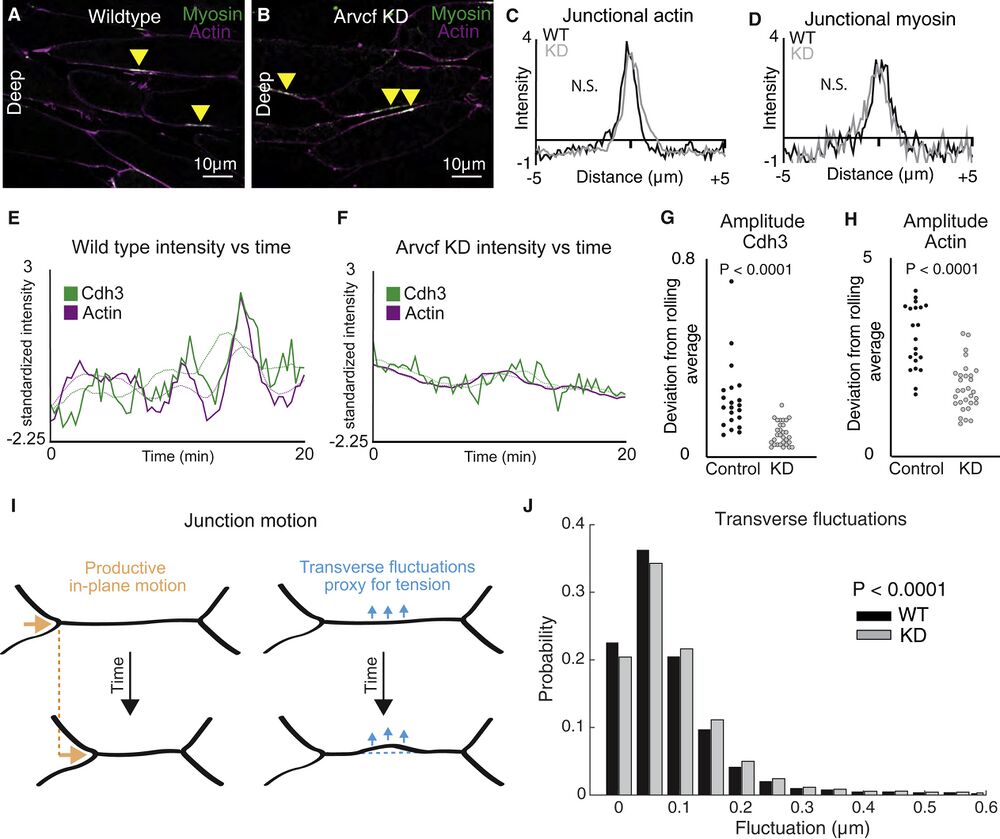
Figure 6. Depletion of Arvcf resulted in a dampening of the oscillatory temporal dynamics of Cdh3 and actin
(A) Image of deep cell-cell interfaces showing actin in magenta and myosin in green. Yellow arrowheads point to myosin accumulations at v-junctions.
(B) Image of deep cell-cell interfaces after Arvcf knockdown. Yellow arrows point to myosin enrichments at v-junctions.
(C) Intensity plots showing the mean intensity of actin at v-junctions. Wild type is shown in black, and Arvcf knockdown cells are shown in gray. Conditions were statistically compared using a KS test.
(D) Intensity plots showing mean intensity of myosin at deep v-junctions. Black shows wild type, and gray shows Arvcf-depleted cells. Conditions were statistically compared using a KS test.
(E) Cdh3 (green) and actin (magenta) intensity plotted over time from a wild-type shortening v-junction. Dashed lines show the rolling average (over 3.33 min) for either Cdh3 or actin.
(F) Plot showing Cdh3 (green) and actin (magenta) intensity over time from an Arvcf-depleted shortening v-junction. Dashed lines show the rolling average.
(G) We quantified the oscillation amplitude as the deviation of a protein’s intensity plot from that same protein’s rolling average. This graph shows the average Cdh3 amplitude for wild-type and Arvcf knockdown v-junctions. Each dot is the average amplitude from a single shortening v-junction. Conditions were compared using a Mann-Whitney test.
(H) The same quantification shown in (J) but looking at actin oscillation amplitude. Again, each dot represents the average amplitude at a single shortening v-junction, and conditions were compared using a Mann-Whitney test.
(I) Schematic showing the transverse fluctuations that we use as a proxy for local junction tension. Orange shows the productive in-plane motion of junction shortening, and blue shows the transverse fluctuations that are opposed to in-plane motion. Dashed lines represent the initial junction position.
(J) Quantification of the probability that a wild-type (black) or Arvcf knockdown (gray) junction will undergo a transverse fluctuation of a given size. The Arvcf knockdown junctions had significantly larger transverse fluctuations. Conditions were compared using a Mann-Whitney test.
Adapted with permission from Cell Press on behalf of Developmental Cell: Huebner and Weng et al. (2022). ARVCF catenin controls force production during vertebrate convergent extension. Dev Cell. 2022 Apr 20;S1534-5807(22)00241-6. doi: 10.1016/j.devcel.2022.04.001. Online ahead of print.
Last Updated: 2022-05-04