Uncovering the mesendoderm gene regulatory network through multi-omic data integration
Camden Jansen, Kitt D Paraiso, Jeff J Zhou, Ira L Blitz, Margaret B Fish, Rebekah M Charney, Jin Sun Cho, Yuuri Yasuoka, Norihiro Sudou, Ann Rose Bright, Marcin Wlizla, Gert Jan C Veenstra, Masanori Taira, Aaron M Zorn, Ali Mortazavi, Ken W Y Cho
Cell Rep. 2022 Feb 15;38(7):110364. doi: 10.1016/j.celrep.2022.110364.
Click here to view article at Cell Reports.
Click here to view article at PubMed.
Highlights
• Built a pipeline to create GRNs using highly dimensional multi-omic datasets
• Predict new TF-DNA/TF-TF interactions during mesendoderm development
• Generate the genome-scale vertebrate mesendodermal network with high fidelity
• Develop an SOM metaclusters visualization resource for multiple RNA- and ChIP-seq sets
Abstract
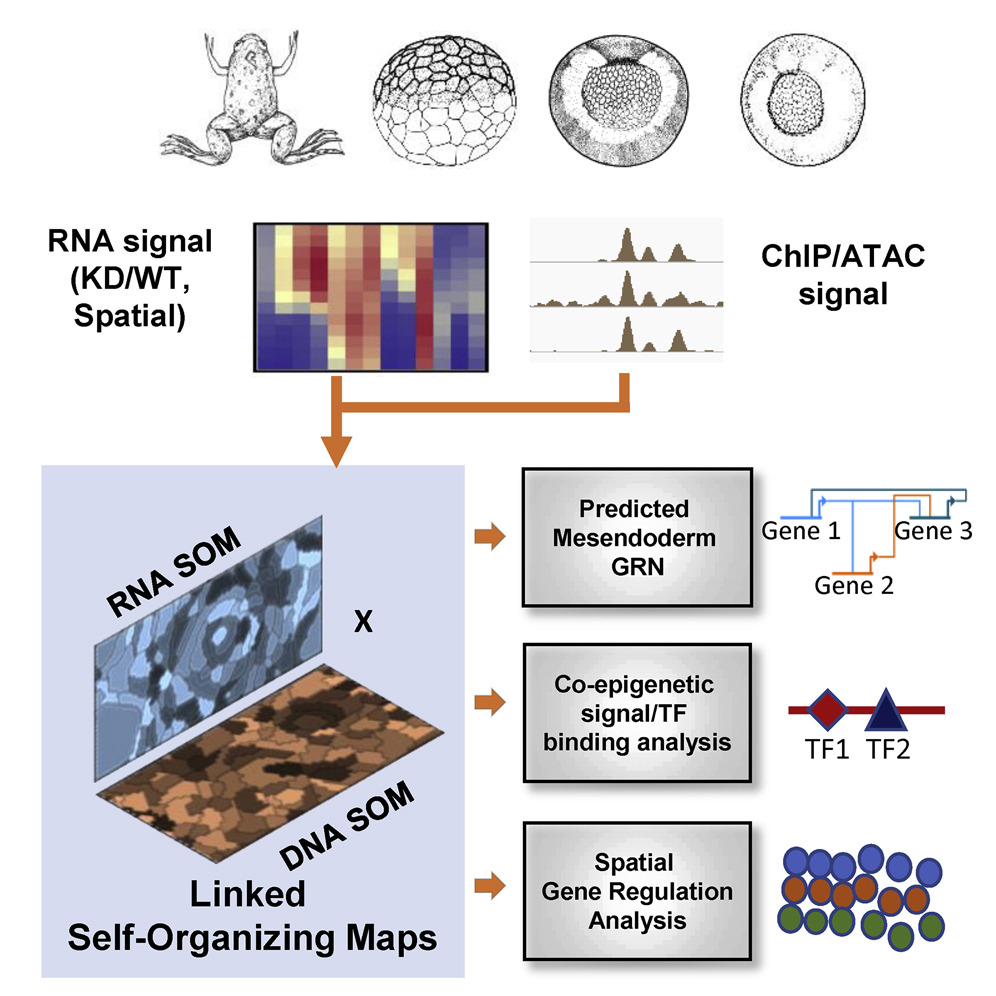
Mesendodermal specification is one of the earliest events in embryogenesis, where cells first acquire distinct identities. Cell differentiation is a highly regulated process that involves the function of numerous transcription factors (TFs) and signaling molecules, which can be described with gene regulatory networks (GRNs). Cell differentiation GRNs are difficult to build because existing mechanistic methods are low throughput, and high-throughput methods tend to be non-mechanistic. Additionally, integrating highly dimensional data composed of more than two data types is challenging. Here, we use linked self-organizing maps to combine chromatin immunoprecipitation sequencing (ChIP-seq)/ATAC-seq with temporal, spatial, and perturbation RNA sequencing (RNA-seq) data from Xenopus tropicalis mesendoderm development to build a high-resolution genome scale mechanistic GRN. We recover both known and previously unsuspected TF-DNA/TF-TF interactions validated through reporter assays. Our analysis provides insights into transcriptional regulation of early cell fate decisions and provides a general approach to building GRNs using highly dimensional multi-omic datasets.
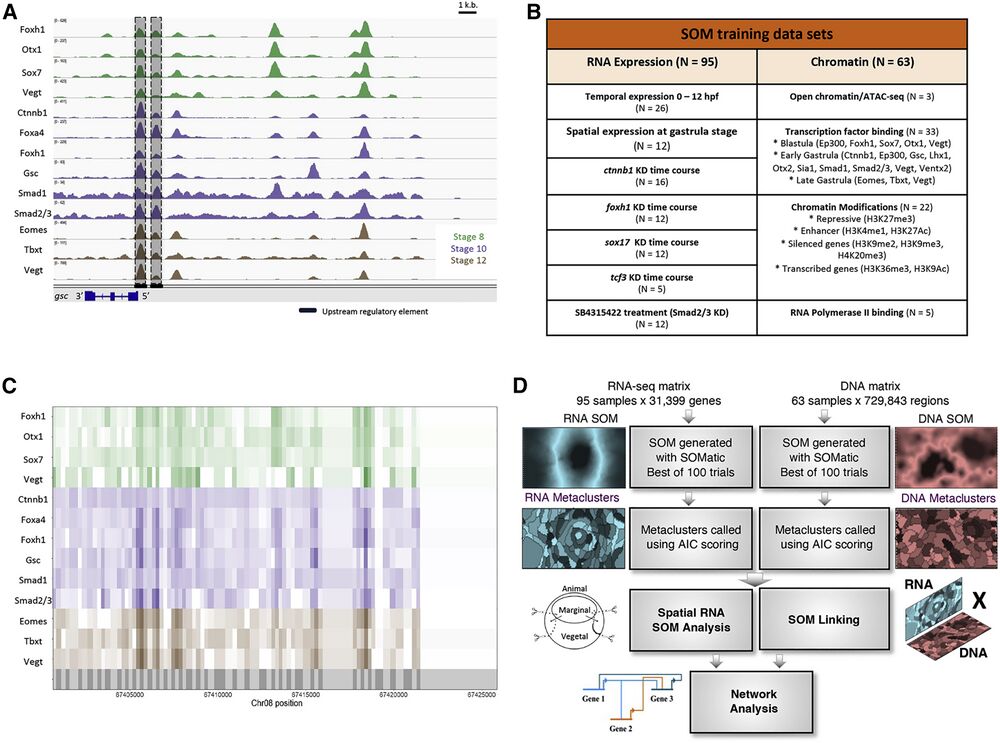
Figure 1. Using self-organizing maps (SOMs) to discover ME GRN
(A) Genome browser view of TF binding during X. tropicalis development. Shown are maternally expressed (Foxh1, Otx1, Sox7, Vegt, Ctnnb1, Smad1, and Smad2/3) and zygotically expressed (Foxa4, Gsc, Eomes, Tbxt, and Vegt) TF binding in the gsc gene locus. Shaded are the well-characterized proximal, distal, and upstream CRMs, associated with TF binding. Further upstream are binding sites in possibly unexplored CRMs.
(B) Datasets used in this analysis, targeting several wild-type and MO-injected embryos at developmental stages important for ME development.
(C) The X. tropicalis genome is partitioned (grey shadings in bottom track) using ChIP-seq and ATAC-seq peak locations. Each partition is assigned ChIP-seq and ATAC-seq signal quantified as reads per kilobase per million (RPKMs) for all chromatin datasets.
(D) The RNA-seq and ChIP-seq/ATAC-seq datasets were each converted into training matrices and clustered using SOM metaclustering using SOMatic. These clusters were then linked using the SOM Linking tool within SOMatic. The pairwise linked metaclusters (LMs) and spatial SOM data were mined for regulatory connections and built into networks.
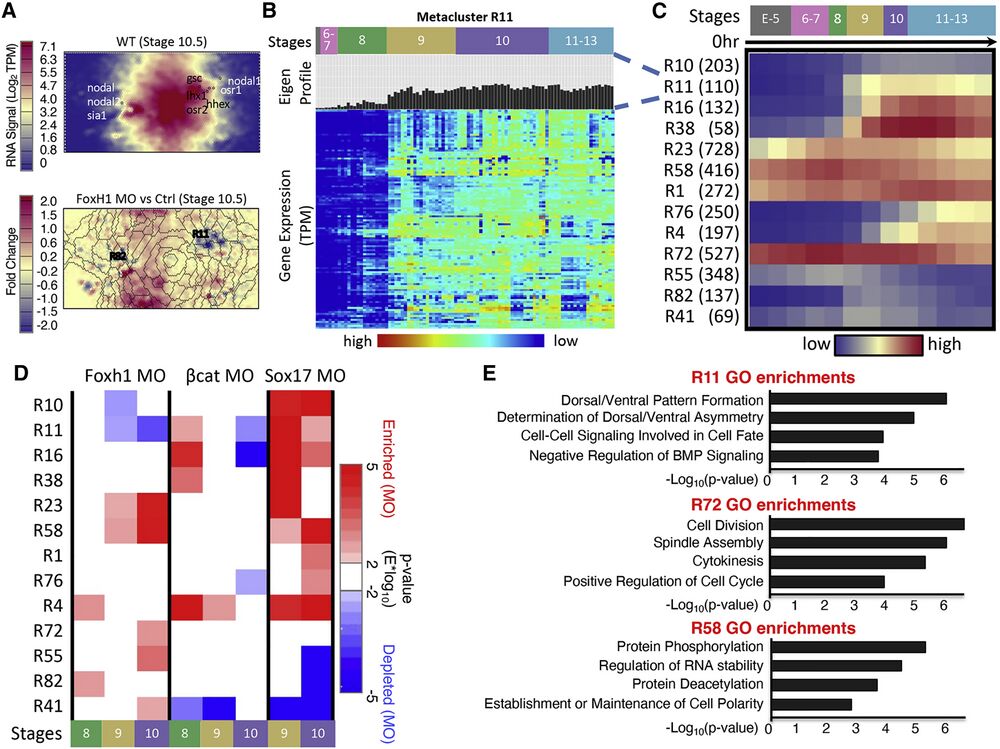
Figure 2. RNA-seq SOM metaclustering reveals developmental gene modules that contain similarly regulated genes
(A) SOM slices relating to gene expression signal Wildtype at stage 10.5 and the fold change between Foxh1 MO and control experiments at stage 10.5. Creation of SOM visualization is described in STAR Methods. Metaclusters containing genes from the core ME network show unique temporal dynamics during development. nodal, nodal2, and sia are grouped left and gsc, nodal1, lhx, and osr2 are grouped right (top). Overlaid metacluster boundaries show the genes that are up- and down-regulated upon Foxh1 MO KD (bottom).
(B) Each metacluster is filled with genes with a similar expression profile (labeled “Eigen-Profile”); for example, a heatmap of the genes in metacluster 11 is shown.
(C) Heatmap of average temporal expression profiles of genes belonging to 13 RNA metaclusters. Parentheses after RNA metaclusters indicate number of genes in each RNA metacluster.
(D) Two-tailed Wilcox hypothesis analysis applied on gene metaclusters. Each metacluster responded to each MO experiment differently at different time points.
(E) GO term enrichments for genes within three example RNA SOM metaclusters. Each metacluster had unique functional enrichments supporting the coherence of these clusters.
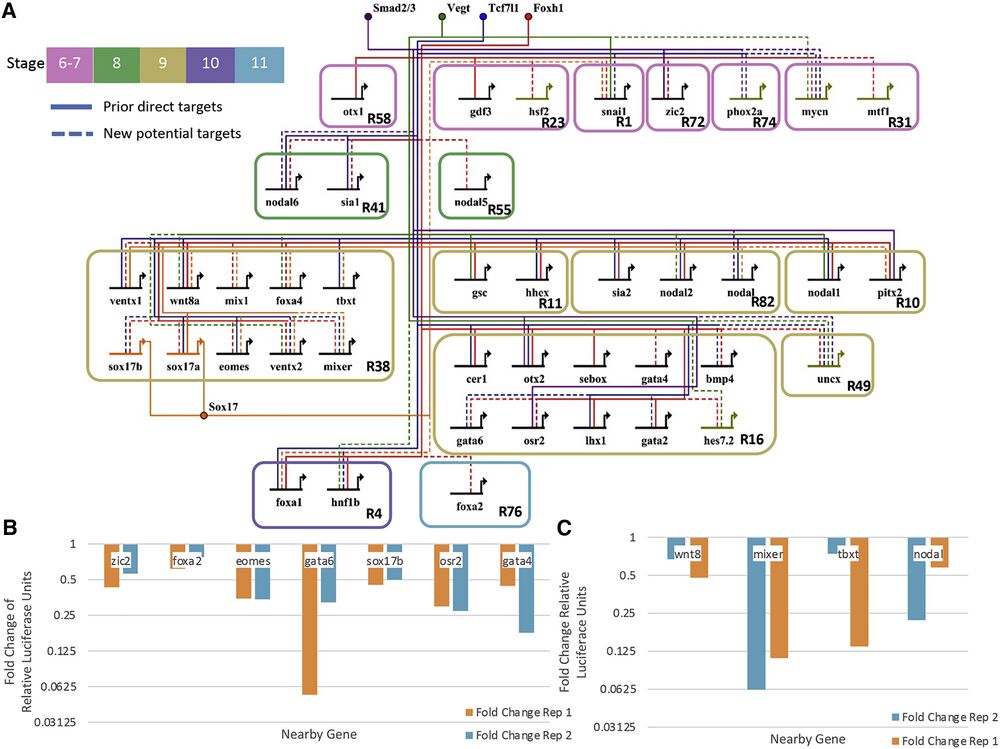
Figure 6. GRN centered on the activity of Tcf7l1, Sox17, Vegt, Smad2/3, and Foxh1
(A) Our predicted developmental GRN. The active CRMs were identified based on the enrichment of their respective TFs, enrichment of Ep300 signal, and DNA binding motif presence. Shown are literature identified targets (“prior direct targets”) and potential new connections (“new potential targets”). Note that only a subset of targets is shown, and the network is focused only on TF and signaling molecule targets.
(B) Fold change of relative luciferase units in log scale of putative CRMs comparing Foxh1 binding site mutations over wild type. Each of these shows that enhancer activity depends on Foxh1 binding sites. Two biologically independent experiments were performed.
(C) Fold change of relative luciferase units of putative CRMs comparing Sox17 binding site mutations over wild type. Each shows that enhancer activity depends on Sox17 binding sites. Two biologically independent experiments were performed.
Adapted with permission from Cell Press on behalf of Cell Reports: Jansen et al. (2022). Uncovering the mesendoderm gene regulatory network through multi-omic data integration. Cell Rep. 2022 Feb 15;38(7):110364. doi: 10.1016/j.celrep.2022.110364.
This work is licensed under a Creative Commons Attribution 4.0 International License. The images or other third party material in this article are included in the article’s Creative Commons license, unless indicated otherwise in the credit line; if the material is not included under the Creative Commons license, users will need to obtain permission from the license holder to reproduce the material. To view a copy of this license, visit http://creativecommons.org/licenses/by/4.0/
Last Updated: 2022-04-25