The Scf/Kit pathway implements self-organised epithelial patterning
Alexandre Chuyen, Charlotte Rulquin, Fabrice Daian, Raphaël Clément, Laurent Kodjabachian, Andrea Pasini
Developmental Cell Volume 56, ISSUE 6, P795-810.E7, MARCH 22, 2021. DOI:https://doi.org/10.1016/j.devcel.2021.02.026
Click here to view article at Developmental Cell.
Highlights
• Xenopus epidermal multiciliated cells evenly space before radial intercalation
• Pattern formation involves mutual repulsion and affinity for outer-layer cell junctions
• Arp2/3-dependent actin remodeling is required for patterning
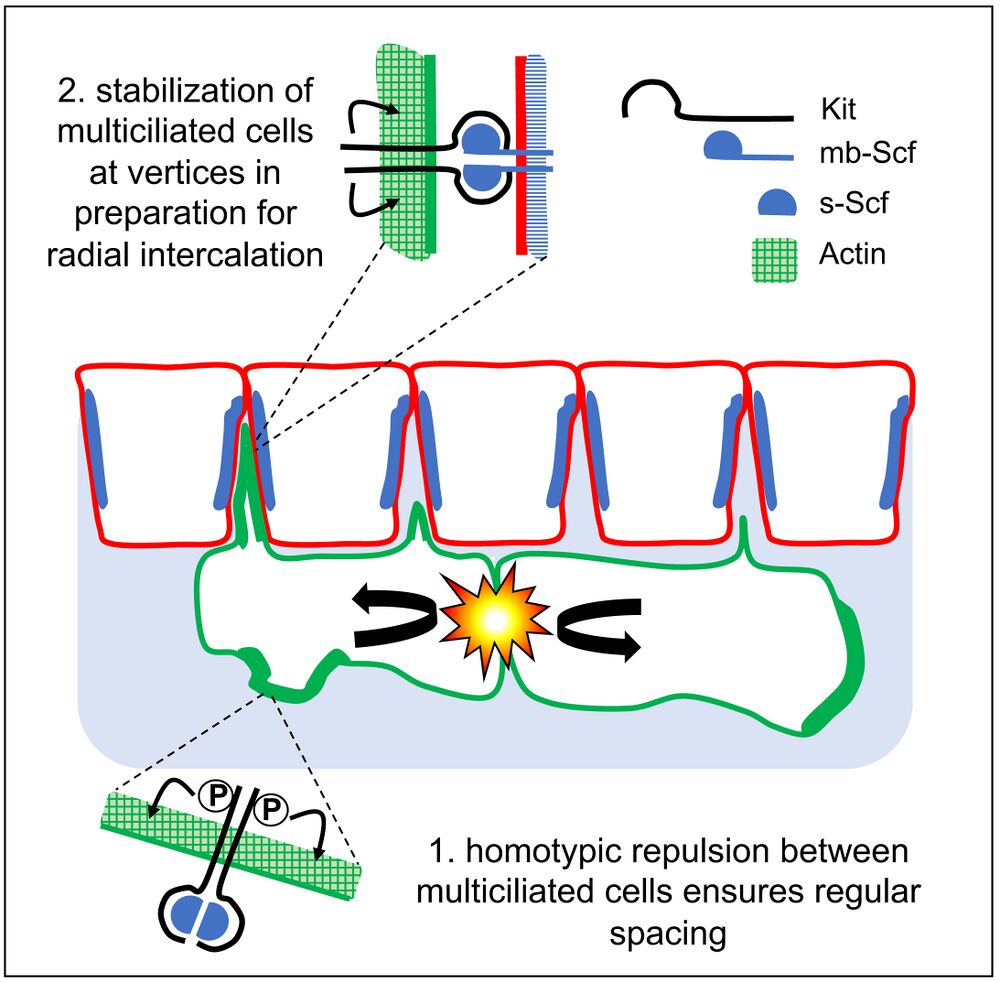
• The Scf/Kit pathway promotes both repulsion and affinity
Summary
How global patterns emerge from individual cell behaviors is poorly understood. In the Xenopus embryonic epidermis, multiciliated cells (MCCs) are born in a random pattern within an inner mesenchymal layer and subsequently intercalate at regular intervals into an outer epithelial layer. Using video microscopy and mathematical modeling, we found that regular pattern emergence involves mutual repulsion among motile immature MCCs and affinity toward outer-layer intercellular junctions. Consistently, Arp2/3-mediated actin remodeling is required for MCC patterning. Mechanistically, we show that the Kit tyrosine kinase receptor, expressed in MCCs, and its ligand Scf, expressed in outer-layer cells, are both required for regular MCC distribution. Membrane-associated Scf behaves as a potent adhesive cue for MCCs, while its soluble form promotes their mutual repulsion. Finally, Kit expression is sufficient to confer order to a disordered heterologous cell population. This work reveals how a single signaling system can implement self-organized large-scale patterning.
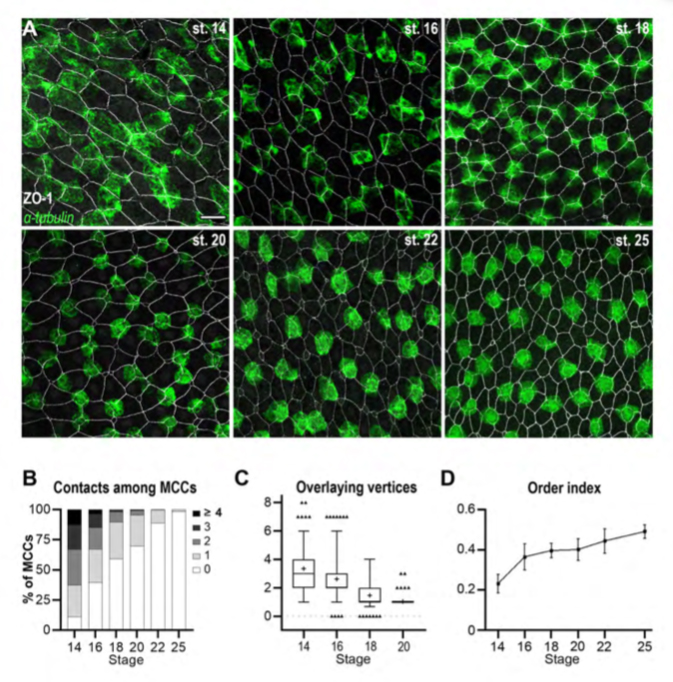
Figure 1. The orderly pattern of mature MCCs results from progressive changes in cell distribution.
A: Fluorescent In Situ Hybridization (FISH) was used to reveal b-tubulin-positive immature MCCs (green), combined to immunofluorescence against the tight junction protein ZO-1 to reveal outer-layer intercellular junctions (white). In the course of development, MCCs were increasingly found as isolated, regularly-shaped cells, each localised in correspondence of a single outer-layer vertex. Scale bar is 25um. B: Graph showing the percentage of b-tub-positive cells directly in contact with varying numbers of other b-tub-positive cells (gray-shaded from 0 to to ≥4). C: Graph showing the number of ZO-1-positive outer-layer vertices superimposable onto the planar projection of each b-tub-positive MCC. Whiskers shows the 2.5-97.5 percentiles. D: Graph showing the order index calculated from Delaunay tessellation of the centroids of b-tub-positive cells. The order index increased during development, reflecting the progressive transition from a chaotic to an orderly MCC distribution.
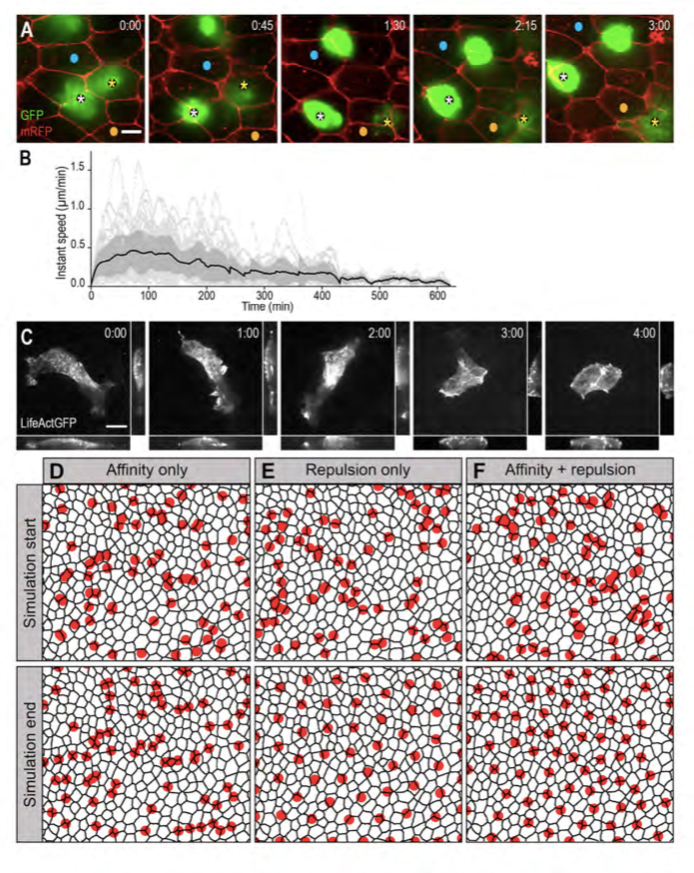
Figure 2. MCCs are motile and in silico modelling reveals that mutual repulsion and affinity for outer-layer junctions are required for proper pattern establishment.
A: Spinning-disk confocal video microscopy was used to track b-tub::GFP transgenic MCCs within the inner epidermal layer. Still frames from movie 1 are shown. Asterisks point two MCCs that moved under mRFP-injected outer-layer cells. Blue and orange dots serve as landmarks to appreciate MCC mobility. B: Graph showing the instant speed of 55 LifeActGFP-expressing MCCs recorded over a maximum of 8 hours. Dotted light-grey lines: instant speeds of individual MCCs. Black line: mean instant speed of the 55 MCCs; the dark grey area represents the standard error. C: Still frames from movie 2. b-tub::LifeActGFP revealed an intense actin-based protrusive activity that progressively shifted from the basolateral to the apical aspect of the cell. For each frame, orthogonal view maximum intensity projection was made on the x axis (bottom panel) and y axis (right panel). D-F: Frames from simulation movies 3, 4 and 5, respectively. The black meshwork represents outer-layer intercellular junctions, and red circles the underlying MCCs. The upper row shows the initial random distribution of MCCs, the bottom row shows the final patterns obtained under the different regimes. D: In a model where MCC affinity for outer-layer junctions dominated, MCCs localised at vertices, but failed to disperse properly. E: In a model where MCC mutual repulsion dominated, MCCs were regularly distributed, but did not localise at vertices. F: In a model where mutual repulsion and affinity for outer-layer junctions were balanced, MCCs were dispersed and positioned at vertices.
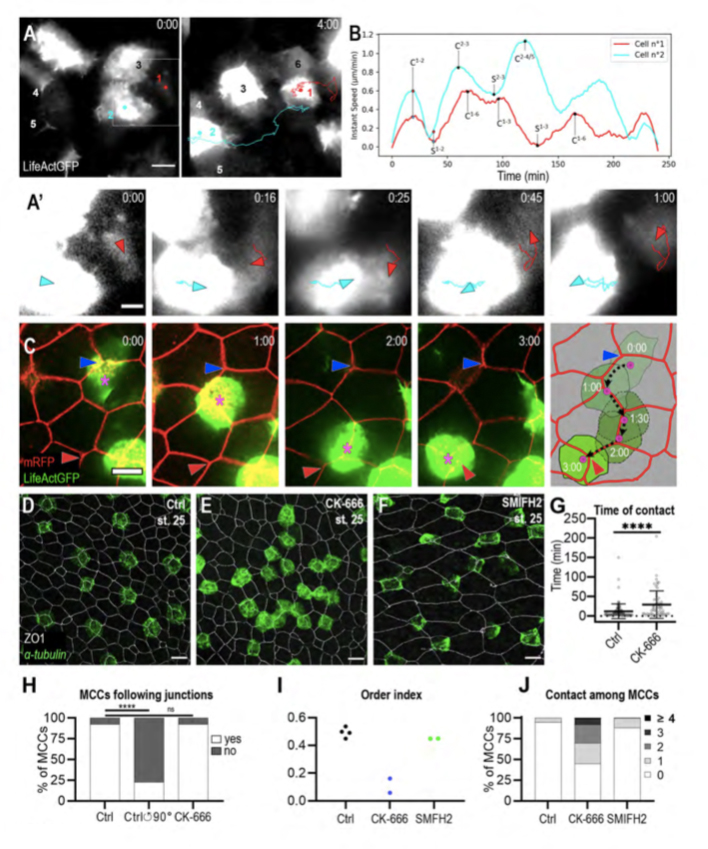
Figure 3. MCCs display both behaviours of mutual repulsion and affinity for outer-layer junctions.
A: Initial and final frames from movie 6. b-tub::LifeActGFP labelling reveals that whenever MCCs come in contact, they moved away from each other. Six MCCs were filmed, of which two (n°1, red dot and n°2, light blue dot) were tracked over the entire duration of the movie. A’: Higher magnification of frames from movie 6 to better show that the collision event between MCCs n°1 (red arrowhead) and n°2 (light blue arrowhead) was followed by a change in their direction of movement and by their separation. B: Graph showing the instant speed of MCCs n°1 (red line) and n°2 (light blue line) from movie 6. ‘C’ and ‘S’ indicate contact and separation events, respectively; mathematical exponents label the MCCs from movie 6 to which contact and separation events refer. C: Frames from movie 7 showing an b-tub::LifeActGFP-labelled MCC (magenta asterisk) moving along the intercellular junctions among overlying outer-layer cells labelled by mRFP. The blue and the red arrowheads highlight the initial and final position of the labelled MCC. The last panel recapitulates the positions of the observed MCC over 3h. The black dotted line shows the displacement of the MCC centroid. D-F: Embryos were treated from stage 12 with 1% DMSO (D), 100uM Arp2/3 inhibitor CK-666 (E), and 50uM Formin inhibitor SMIFH2 (F) and analysed at stage 25 by b-tub FISH and ZO-1 IF to examine MCC patterning. E: Following CK-666 treatment, MCCs intercalated into the outer layer but were irregularly distributed. F: Treatment with SMIFH2 led to a normal MCC patterning but impaired apical insertion and expansion. In all cases, scale bar is 20um. G: Graph showing the duration of MCC mutual contacts in control and CK-666 treated embryos. **** p-value < 0.0001 in a student t-test. H: Graph showing the proportion of MCCs that followed outer-layer junctions over a period of 2h in controls, in controls where the outer-layer signal was rotated 90° counter-clockwise in silico, and in CK-666 treated embryos. I: Graph showing MCC order index in CK-666-treated embryos vs control embryos. J: Graph showing the distribution of the number of contacts between MCCs at stage 25 in control, CK-666- and SMIFH2-treated embryos.
Adapted with permission from Cell Press on behalf of Developental Cell: Chuyen et al. (2021). The Scf/Kit pathway implements self-organised epithelial patterning. Developmental Cell Volume 56, ISSUE 6, P795-810.E7, MARCH 22, 2021. DOI:https://doi.org/10.1016/j.devcel.2021.02.026.