Spatiotemporal Patterning of Zygotic Genome Activation
Hui Chen, Lily C. Einstein, Shawn C. Little, Matthew C. Good
Developmental Cell Volume 49, Issue 6, P852-866.E7, June 17, 2019
Click here to view article at Developmental Cell.
Click here to view article on Pubmed.
Click here to view the press release.
Click here to view the article on Xenbase.
Highlights
Quantitative, single-cell imaging of nascent transcription during early embryogenesis
Large-scale ZGA onset is not globally uniform; it follows a stereotypic spatial pattern
Patterned ZGA onset is explained by a cell sizer, not a simple timer or cycle counter
Reducing cell size is sufficient to trigger precocious ZGA in Xenopus embryos
Abstract
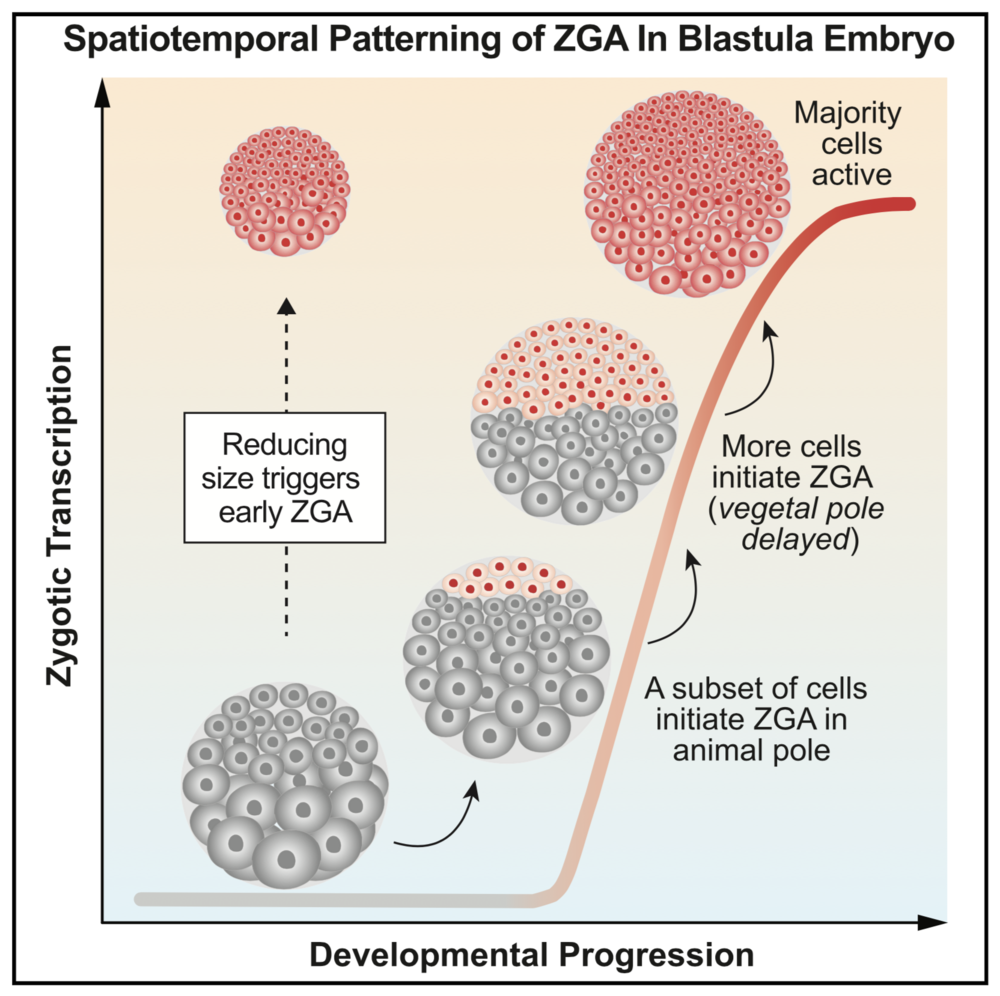
A defining feature of early embryogenesis is the tran- sition from maternal to zygotic control. This transition requires embryo-wide zygotic genome activation (ZGA), but the extent of spatiotemporal coordination of ZGA between individual cells is unknown. Multiple interrelated parameters, including elapsed time, completed cycles of cell division, and cell size may impact ZGA onset; however, the principal determi- nant of ZGA during vertebrate embryogenesis is debated. Here, we perform single-cell imaging of large-scale ZGA in whole-mount Xenopus embryos. We find a striking new spatiotemporal pattern of ZGA whose onset tightly correlates with cell size but not with elapsed time or number of cell divisions. Further, reducing cell size induces premature ZGA, dose dependently. We conclude that large-scale ZGA is not spatially uniform and that its onset is determined at the single-cell level, primarily by cell size. Our study suggests that spatial patterns of ZGA onset may be a common feature of embryonic systems.
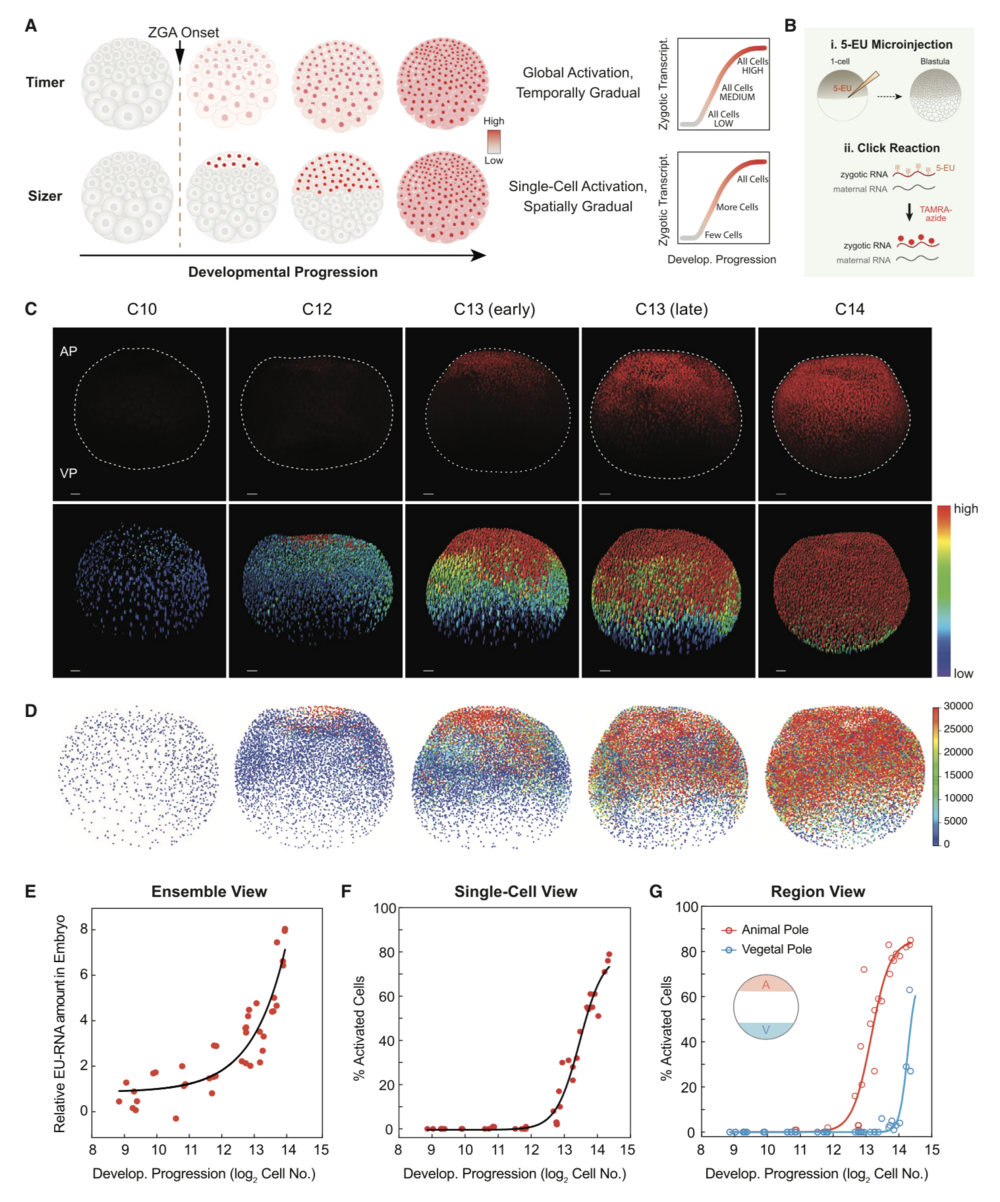
Figure 1. Spatiotemporal Patterning of Zygotic Genome Activation at the Single-Cell Level in Xenopus Early Embryogenesis
(A) Hypotheses for patterning of genome activation in blastula embryos based on a timer and sizer model, respectively. Color scale indicates low (gray) to high (red) transcription.
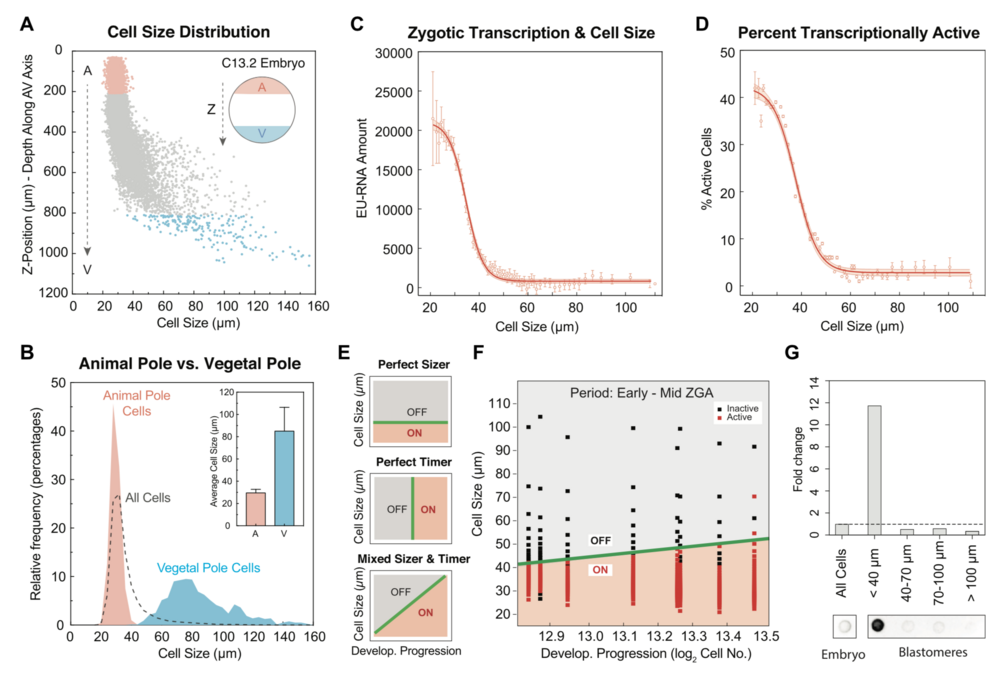
Figure 3. Activation of Zygotic Transcription Depends on Achieving a Critical Cell Size
(A) Cell-size distribution along the AV axis in a single embryo at $C13.2. The dashed arrows indicate the Z-position from the animal pole (A, red) to vegetal pole (V, blue).
(B) Histogram of cell-size distribution in the animal pole (red), vegetal pole (blue) and whole embryos (dashed line) at $C13.2. Data from 5 embryos binned by cell size in 4-mm increments. Inset plot shows average cell size in the animal pole (A) and vegetal pole (V); error bar, standard deviation.
(C and D) Nuclear EU-RNA amount (C) and percentage of transcriptionally active cells (D) as a function of cell diameter in embryos at $C13.2. Data from 5 embryos binned in 1-mm increments of cell diameter and represented as mean ± 95% confidence interval (CI). Sigmoidal fit to data with 95% CI band.
(E) Predicted decision boundaries for ZGA with a perfect sizer (top), perfect timer (middle), and mixed sizer and timer (bottom). Gray, inactive; red, active; green line, decision boundary for ZGA.
(F) Logistic regression boundary decision for ZGA as a function of cell size and developmental progression. Each point is a bin of 200 cells for each of 8 embryos at $C12.8–C13.5. Binary activation based on threshold amount EU-RNA. Black square, inactive cells; red square, active cells; green line, decision boundary for ZGA.
(G) Dot blot for accumulated nascent EU-RNA in blastomeres at various size ranges isolated and sorted from embryos at $C13. The fold change was normalized to whole embryos.
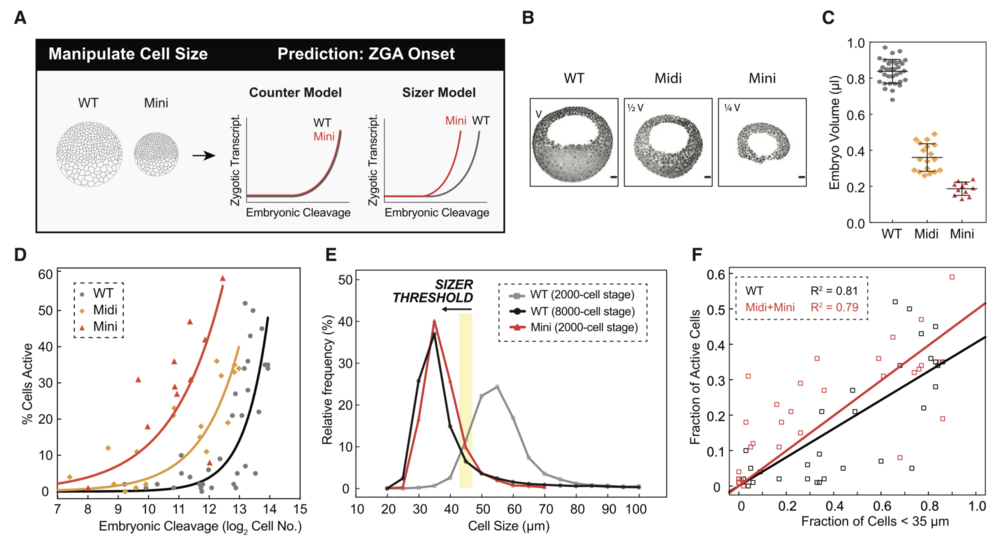
Figure 6. Premature ZGA in Miniature Embryos Rules out a Cell-Cycle Counter Model and Supports a Cell Sizer Model for ZGA
(A) Schematic predictions of ZGA onset in wild-type (WT) and miniature (mini) embryos for a counter and sizer model.
(B) Representative sagittal slices of WT, midi (half volume, 1/2 V), and mini (quarter volume, 1/4 V) embryos stained for DNA (black pseudocolored). Scale bars, 100 mm.
(C) Volume measurements for WT (gray), midi (orange), and mini (red) embryos at blastula stages. Each point indicates one embryo. Data represented as mean ± standard deviation.
(D) Percentage of transcriptionally active cells as a function of embryonic cleavage for WT (gray), midi (orange), and mini (red) embryos. Each point indicates one embryo. Data pooled from four independent experiments. Exponential fits to data as visual aid.
(E) Histogram of cell-size distributions for WT embryos at $2,000-cell stage ($C11; gray) and $8,000-cell stage ($C13; black) and mini-embryos at $2,000-cell stage ($C11; red). Yellow stripe indicates a putative threshold of $45 mm.
(F) Fraction of transcriptionally active cells as a function of cells smaller than 35 mm for WT (black) and midi and mini (red) embryos. Each square indicates one embryo. Linear fits to data.
Adapted with permission from Elsevier on behalf of Developmental Cell: Chen et al. (2019). Spatiotemporal Patterning of Zygotic Genome Activation in a Model Vertebrate Embryo. Developmental Cell Volume 49, Issue 6, P852-866.E7, June 17, 2019 DOI:https://doi.org/10.1016/j.devcel.2019.05.036. Copyright (2019).