Gene expression during Xenopus embryogenesis measured at single-cell resolution
Science. April 26, 2018
The dynamics of gene expression in vertebrate embryogenesis at single-cell resolution.
Briggs JA, Weinreb C, Wagner DE, Megason S, Peshkin L, Kirschner MW, Klein AM.
Click here to view article at Science.
Click here to view on Pubmed.
Click here to view article on Xenbase.
Abstract
Time series of single-cell transcriptome measurements can reveal dynamic features of cell differentiation pathways. From measurements of whole frog embryos spanning zygotic genome activation through early organogenesis, we derived a detailed catalog of cell states in vertebrate development and a map of differentiation across all lineages over time. The inferred map recapitulates most if not all developmental relationships and associates new regulators and marker genes with each cell state. We find that many embryonic cell states appear earlier than previously appreciated. We also assess conflicting models of neural crest development. Incorporating a matched time series of zebrafish development from a companion paper, we reveal conserved and divergent features of vertebrate early developmental gene expression programs.
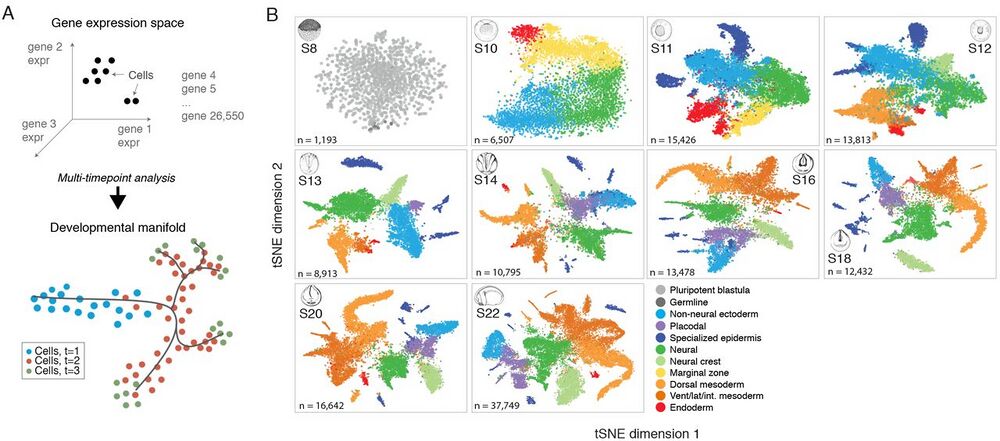
Fig. 1 Dissection of early Xenopus tropicalis development by scRNA-seq.
(A) Single-cell transcriptomes represent points in a high-dimensional gene expression space. By collecting single-cell transcriptomes over time of embryo development, it is possible to infer a continuum gene expression manifold connecting cell states across all lineages. (B) Summary of scRNA-seq developmental timecourse including 136,966 single-cell transcriptomes sampled over ten embryonic stages (S8-22). tSNE plots show increasing cell population structure over time. Colors indicate major tissues grouped by germ layer.
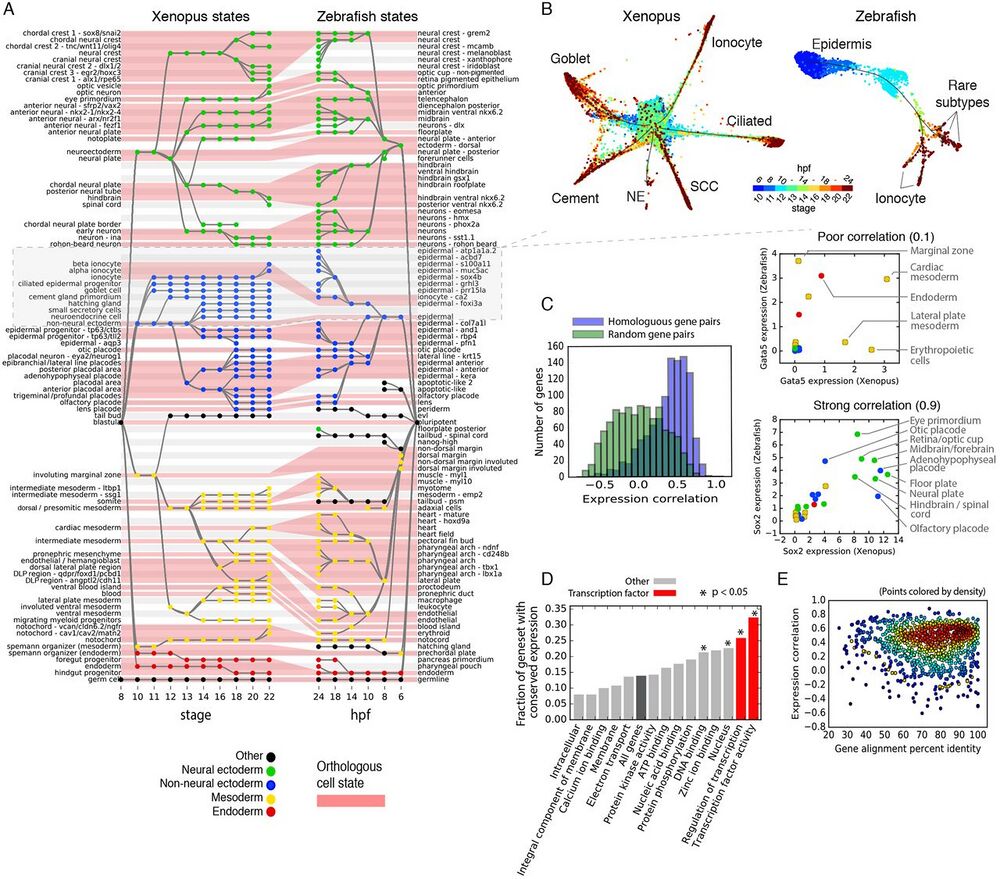
Fig. 4 Similarities and differences in developmental cell state hierarchies and gene expression between frog and fish.
(A) Xenopus and Zebrafish cell state trees aligned by orthologous cell states (red shading). Gray/white stripes provide a visual guide. (B) Single-cell visualization of matched epidermal subtrees in frog and fish showcase similarities and differences in developmental hierarchy. SCC, small secretory cell; NE, neuroendocrine cell. Unidentified zebrafish cell types are labeled by marker genes. (C) Ortholog genes across species have variable conservation of cell state specific expression. Just 30% of self-similar orthologs are conserved at a 95% FDR compared to random gene pairs. Right panels: examples of highly (Sox2) and poorly (Gata5) correlated TFs across species. (D and E) Function, not sequence, predicts gene expression conservation: (D) Orthologs with highly conserved expression patterns across species are enriched in TF-associated GO terms. P-values show Bonferroni-corrected binomial test results. (E) Protein sequence conservation is not correlated with gene expression conservation (r = 0.01; P = 0.6).
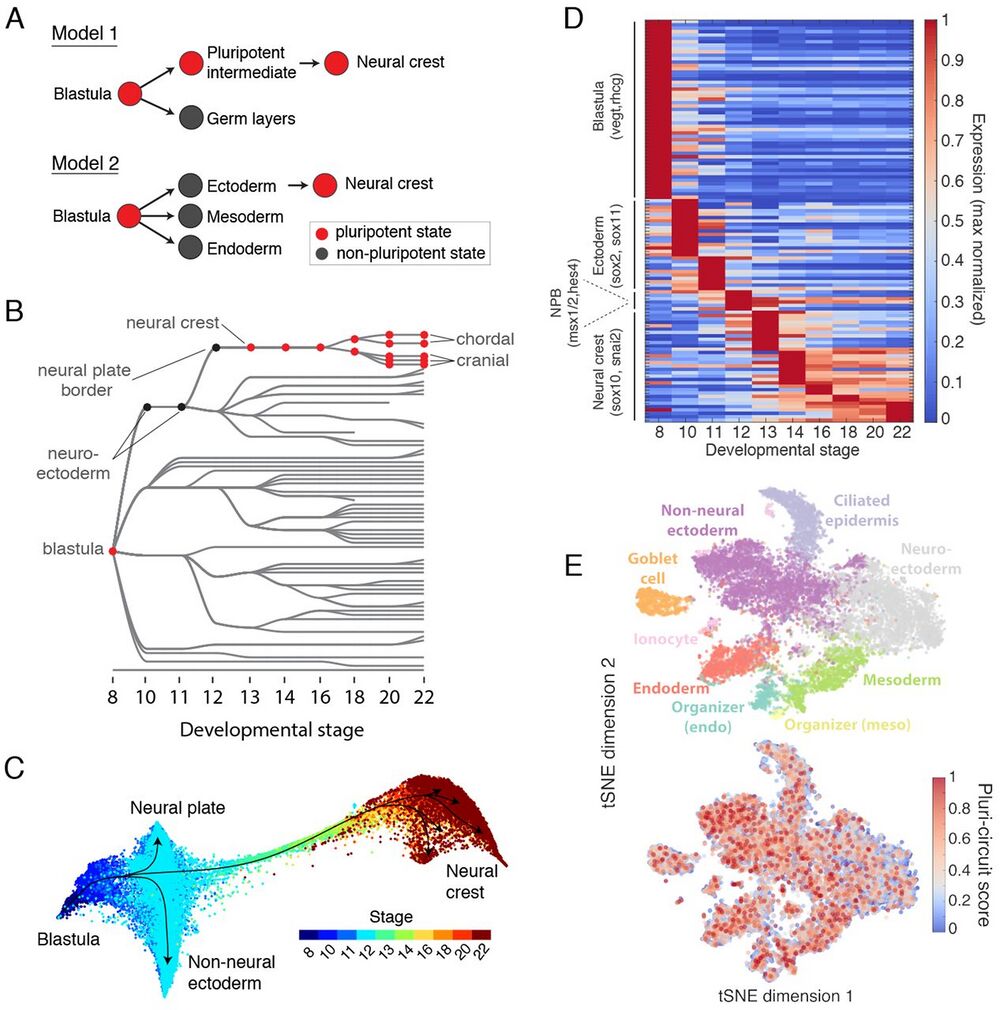
Fig. 7 Assessing the retention of pluripotency during neural crest development.
(A) Contrasting models of neural crest development. Model 1: neural crest emerges from an intermediate population that retains blastula pluripotency (29). Model 2: neural crest emerges from ectoderm and reactivates pluripotency. (B) Ancestors inferred from scRNA-seq support model 2, where neural crest derives from neural cells at the neural plate border. (C) Single-cell visualization (SPRING) of neuroectoderm, non-neural ectoderm, and neural crest also indicates that neural crest derives from the neural plate border. (D) Neural crest differentiation involves hundreds of >3-fold dynamic marker genes. (E) At stage 11, the shared pluripotency circuit proposed by Buitrago-Delgado et al. (30) - foxd3, c-myc (myca), id3, tfap2a, ventx2.1, ets1, and snai1 and pou3f5.2 - is expressed broadly in nonpluripotent cells. Score shows normalized aggregate expression; see fig. S18 for individual genes.
Adapted with permission from American Association for the Advancement of Science © 2018: Briggs et al. (2018). The dynamics of gene expression in vertebrate embryogenesis at single-cell resolution. Science 26 Apr 2018: eaar5780
DOI: 10.1126/science.aar5780
"Readers may view, browse, and/or download material for temporary copying purposes only, provided these uses are for noncommercial personal purposes. Except as provided by law, this material may not be further reproduced, distributed, transmitted, modified, adapted, performed, displayed, published, or sold in whole or in part, without prior written permission from the publisher."