Integration of over 9,000 mass spectrometry experiments builds a global map of human protein complexes
Mol Syst Biol. 2017 Jun 8;13(6):932. doi: 10.15252/msb.20167490.
Drew K1, Lee C, Huizar RL, Tu F, Borgeson B, McWhite CD, Ma Y, Wallingford JB, Marcotte EM.
Abstract
Macromolecular protein complexes carry out many of the essential functions of cells, and many genetic diseases arise from disrupting the functions of such complexes. Currently, there is great interest in defining the complete set of human protein complexes, but recent published maps lack comprehensive coverage. Here, through the synthesis of over 9,000 published mass spectrometry experiments, we present hu.MAP, the most comprehensive and accurate human protein complex map to date, containing > 4,600 total complexes, > 7,700 proteins, and > 56,000 unique interactions, including thousands of confident protein interactions not identified by the original publications. hu.MAP accurately recapitulates known complexes withheld from the learning procedure, which was optimized with the aid of a new quantitative metric (k-cliques) for comparing sets of sets. The vast majority of complexes in our map are significantly enriched with literature annotations, and the map overall shows improved coverage of many disease-associated proteins, as we describe in detail for ciliopathies. Using hu.MAP, we predicted and experimentally validated candidate ciliopathy disease genes in vivo in a model vertebrate, discovering CCDC138, WDR90, and KIAA1328 to be new cilia basal body/centriolar satellite proteins, and identifying ANKRD55 as a novel member of the intraflagellar transport machinery. By offering significant improvements to the accuracy and coverage of human protein complexes, hu.MAP (http://proteincomplexes.org) serves as a valuable resource for better understanding the core cellular functions of human proteins and helping to determine mechanistic foundations of human disease.
View article at EMBO Press.
View article on Pubmed.
_______________________________________________
Synopsis
Integrating the largest-scale mass spectrometry protein interaction datasets from a variety of human and animal cells and tissues in a machine-learning framework generates the most comprehensive and accurate human protein complex map to date.
Thousands of new interactions are identified from affinity purification/mass spectrometry datasets by applying a weighted matrix model of interactions.
The resulting protein complex map strongly improves coverage of disease related genes and is examined in depth for ciliopathies.
Novel centriolar satellite members are predicted and experimentally validated, and the map reveals ANKRD55 to be a new member of the intraflagellar transport machinery.
_______________________________________________
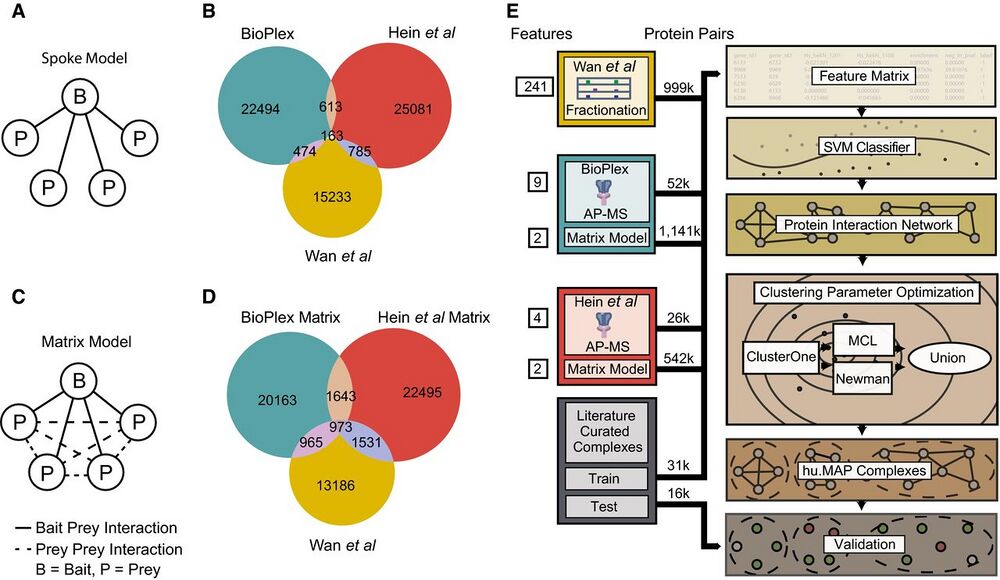
Figure 1. Re-analysis of published AP-MS experiments improves overlap among protein interaction networks.
A Graphical schematic of spoke model applied to AP-MS datasets. In the spoke model, all interactions must include a bait protein.
B Venn diagram of overlap between published large-scale protein interaction networks BioPlex (AP-MS), Hein et al (AP-MS), and Wan et al (CF-MS). Protein interactions in BioPlex and Hein et al were generated from a spoke model.
C Graphical schematic of matrix model applied to AP-MS datasets. In the matrix model, interactions are allowed between prey proteins.
D Venn diagram of overlap between protein interaction networks where a weighted matrix model was applied to BioPlex and Hein et al. Sizes of weighted matrix model protein interaction networks were kept constant with published networks (for this analysis only while the full networks were used for integration). Note an increase in the overall number of overlapping interactions when compared to (B).
E Diagram of protein complex discovery workflow. Three protein interaction networks, BioPlex, Hein et al, and Wan et al, were combined into an integrated protein complex network and clustered to identify protein complexes. Parameters for the SVM and clustering algorithms were optimized on a training set of literaturecurated complexes and validated on a test set of complexes.
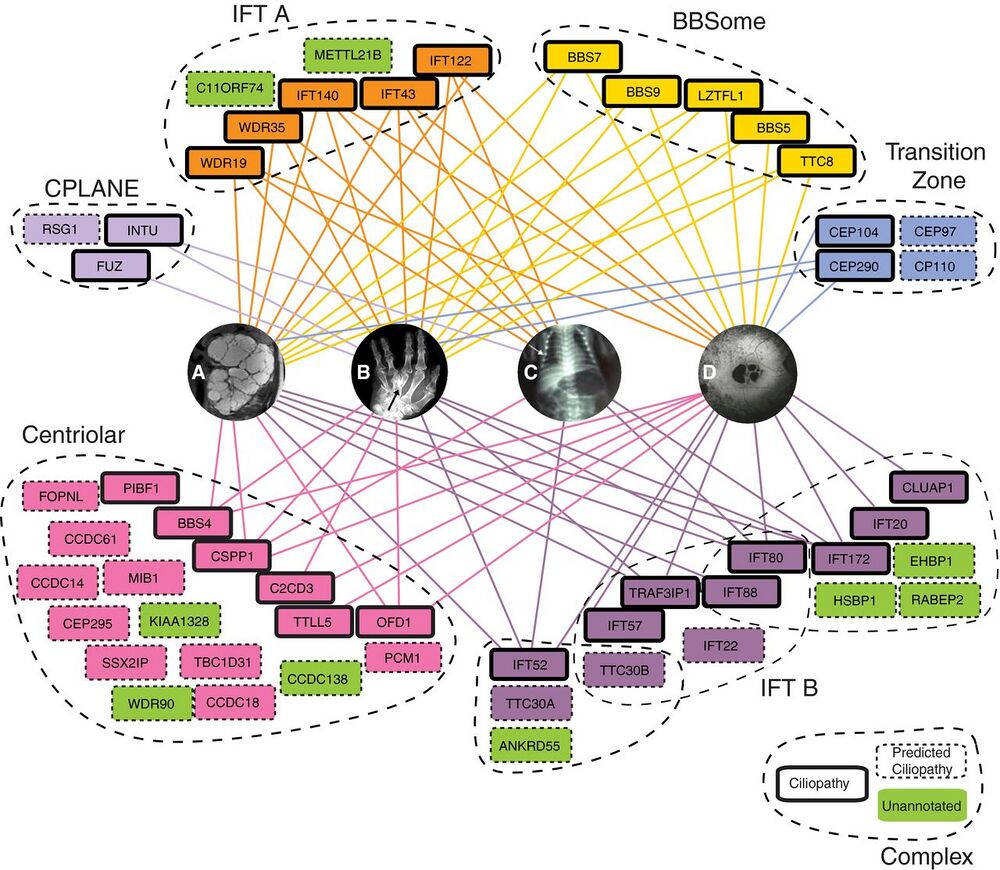
Figure 5. Select complexes in the map are strongly linked to human ciliopathies.
Eight complexes are highlighted with ciliopathy-linked subunits (bold outlines), predicted ciliopathy subunits (dashed outlines), and their association with four representative ciliopathy phenotypes (A–D). We predict links to ciliopathies for uncharacterized proteins (green) that are co-complex with known ciliopathy genes. All edges to ciliopathy phenotypes are mapped from OMIM (Amberger et al, 2015) or direct from literature (Krock & Perkins, 2008; Keady et al, 2011; Chang et al, 2015; Toriyama et al, 2016).
A Cystic kidney phenotype represented by polycystic kidneys from patient with OFD1 variant, adapted from Chetty-John et al (2010).
B Digit malformations represented by polydactyly of Bardet–Biedl syndrome patient with LZTFL1 (BBS17) variant, adapted from Schaefer et al (2014).
C Short-rib phenotype represented by chest narrowing of Jeune asphyxiating thoracic dystrophy individual with IFT80 variant, adapted from Beales et al (2007).
D Maculopathy represented by retinitis pigmentosa of Senior–Loken syndrome patient with mutation in WDR19 (Coussa et al, 2013).
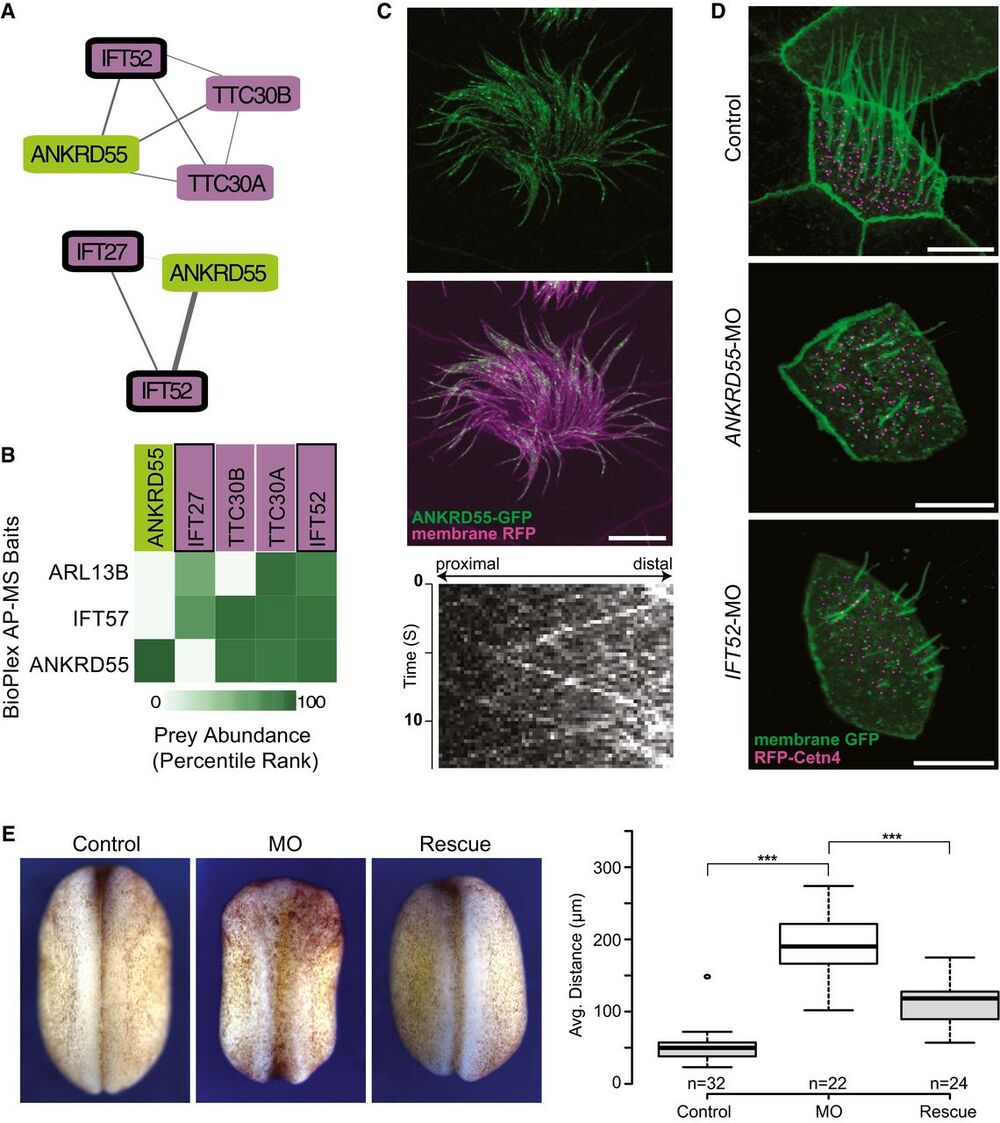
Figure 7. ANKRD55 is a new component of the intraflagellar transport (IFT) particle, is important for ciliogenesis, and has a role in neural tube closure.
A Network view of two IFT sub-complexes associated with ANKRD55.
B Matrix of AP-MS experiments shows strong support for ANKRD55 association with known IFT proteins.
C ANKRD55 localizes to cilia as predicted from co-complex interactions, as assayed in vivo in multi-ciliated Xenopus laevis epithelial cells. Scale bar: 10 lm. Each image is representative of 18 cells from six different embryos. Kymograph of ANKRD55 localized to cilia in vivo reveals rapid trafficking along the length of the cilia (representative out of 36 multi-ciliated cells).
D Morpholino knockdown of ANKRD55 results in reduced count and length of cilia, in a manner similar to the control IFT52 knockdown, supporting a role in ciliogenesis for ANKRD55. Scale bar: 10 lm. Each image is representative of 18 cells from six different embryos.
E Dorsal view of stage 19 X. laevis embryos displays that ANKRD55 knockdown causes neural tube closure defects that are rescued by wild-type ANKRD55 mRNA. The Tukey box plot displays average distance between neural folds in control (n = 32), morphant (n = 22), and rescue (n = 24) embryos. ***P < 0.0001, two-sample Kolmogorov–Smirnov test. Boxes indicate median (inner band), first quartile (bottom) and third (top) quartile. Whiskers indicate 1.5 interquartile range. Dots indicate outliers.
Adapted with permission from EMBO Press: Drew et al. (2017). Integration of over 9,000 mass spectrometry experiments builds a global map of human protein complexes. Mol Syst Biol. 2017 Jun 8;13(6):932. doi: 10.15252/msb.20167490. Copyright 2017.
This work is licensed under a Creative Commons Attribution 4.0 International License. The images or other third party material in this article are included in the article’s Creative Commons license, unless indicated otherwise in the credit line; if the material is not included under the Creative Commons license, users will need to obtain permission from the license holder to reproduce the material. To view a copy of this license, visit http://creativecommons.org/licenses/by/4.0/