miR-182 Regulates Slit2-Mediated Axon Guidance by Modulating the Local Translation of a Specific mRNA
Cell Rep. January 31, 2017, 18 (5): 1171-1186.
Bellon A, Iyer A, Bridi S, Lee FC, Ovando-Vá,zquez C, Corradi E, Longhi S, Roccuzzo M, Strohbuecker S, Naik S, Sarkies P, Miska E, Abreu-Goodger C, Holt CE, Baudet ML.
View article at Cell Reports.
View article on Pubmed.
View article on Xenbase.
Abstract
During brain wiring, cue-induced axon behaviors such as directional steering and branching are aided by localized mRNA translation. Different guidance cues elicit translation of subsets of mRNAs that differentially regulate the cytoskeleton, yet little is understood about how specific mRNAs are selected for translation. MicroRNAs (miRNAs) are critical translational regulators that act through a sequence-specific mechanism. Here, we investigate the local role of miRNAs in mRNA-specific translation during pathfinding of Xenopus laevis retinal ganglion cell (RGC) axons. Among a rich repertoire of axonal miRNAs, miR-182 is identified as the most abundant. Loss of miR-182 causes RGC axon targeting defects in vivo and impairs Slit2-induced growth cone (GC) repulsion. We find that miR-182 targets cofilin-1 mRNA, silencing its translation, and Slit2 rapidly relieves the repression without causing miR-182 degradation. Our data support a model whereby miR-182 reversibly gates the selection of transcripts for fast translation depending on the extrinsic cue.
 ,
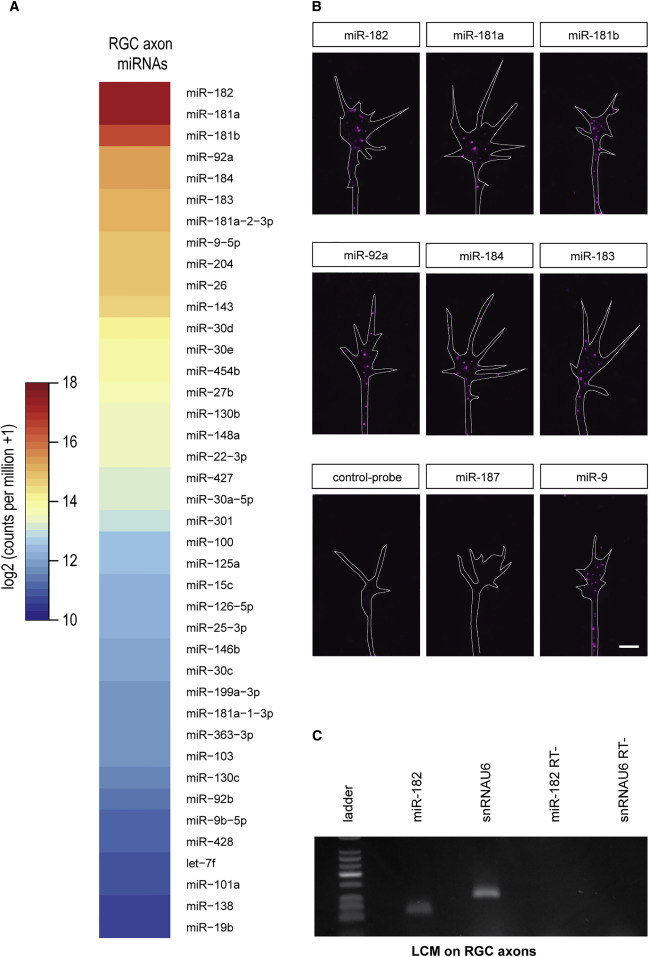
Figure 1. miR-182 Is Localized in RGC Axons (A) Heatmap representing the average expression of mature miRNAs from two axonal small RNA-sequencing (sRNA-seq) libraries prepared from stage 37/38 retinal cultures. The figure is sorted by decreasing axonal average values. (B) Fluorescent ISH on stage 35/36 RGC GCs cultured in vitro for 24 hr. (C) TaqMan qPCR performed on RNA extracted from laser-captured stage 37/38 RGC axons. U6 snRNA was used as positive control, because it is found in developing axons (Natera-Naranjo et al., 2010, Zhang et al., 2013 and Hancock et al., 2014). RT&minus,, no template negative control, snRNAU6, U6 snRNA. Scale bar, 5 &mu,m (B). See also Figure S1 and Table S1.
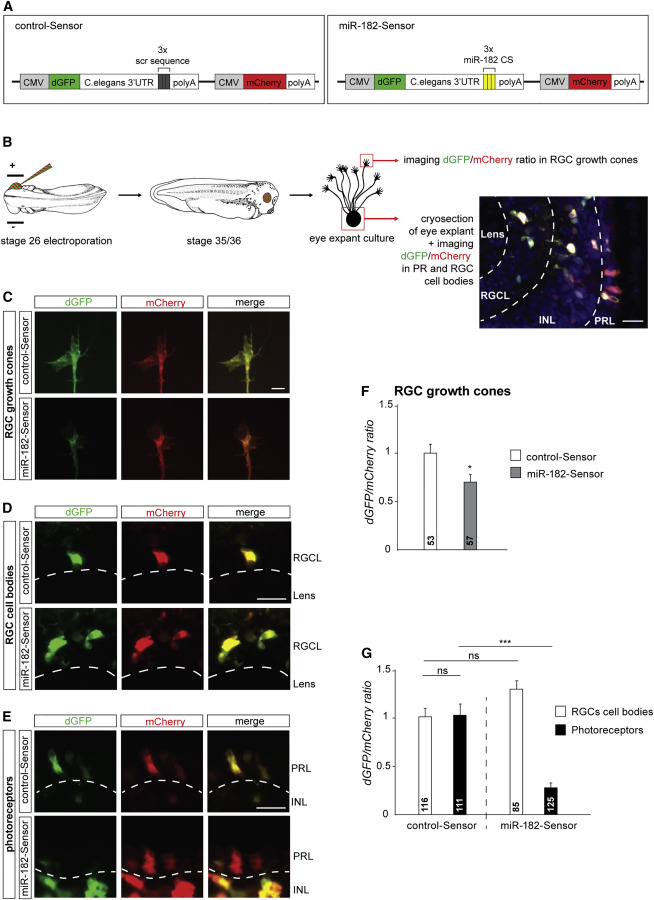
Figure 2. miR-182 Is Active and Enriched in RGC Axons (A) Sensor construct design. (B) Schematic representation of the experimental protocol. (C&ndash,E) Illustrative images of RGC GCs (C), RGC soma (D), or PRs (E) following retinal electroporation of control-Sensor or miR-182-Sensor. Clear examples of dGFP/mCherry ratio decrease are shown in (C) and (E). (F and G) Quantification of the dGFP/mCherry ratio at the RGC GCs, soma, or PRs. Values are mean ±, SEM. Mann-Whitney test (F) and two-way ANOVA followed by Tukey post hoc test (G), &lowast,p <, 0.05, &lowast,&lowast,&lowast,&lowast,p <, 0.0001. ns, nonsignificant, CMV, cytomegalovirus promoter, CS, complementary sequence, dGFP, destabilized GFP, INL, inner nuclear layer, PRL, photoreceptor layer, RGCL, retinal ganglion cell layer. Scale bars, 20 &mu,m (B, D, and E) and 5 &mu,m (C). See also Figure S2.
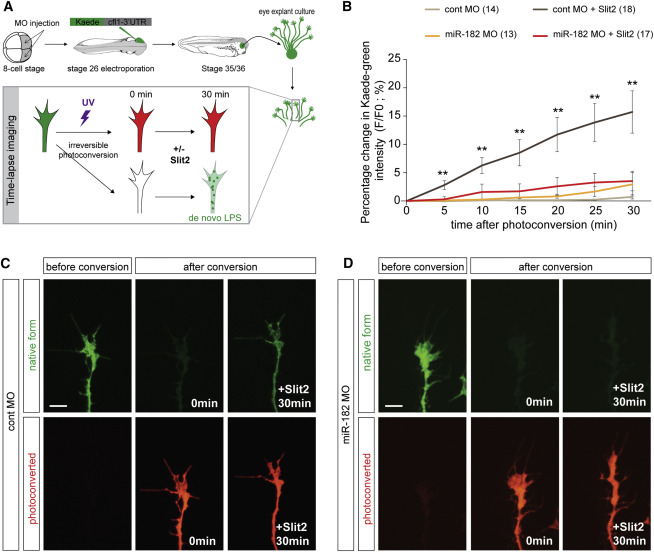
Figure 6. miR-182 Is Required for Slit2-Induced Local Translation of Cfl1 in RGC GCs (A) Schematic representation of the experimental protocol. After 24 hr, RGC axons were isolated from their cell bodies. Bath application of Slit2 at a suboptimal concentration was used to avoid collapse. Vehicle was used as control. Recovery of the newly synthesized Kaede green protein was monitored over time. (B) Quantification of the recovery of Kaede green signal. Data are presented as the percentage change of the fluorescence intensity (F) over time. Numbers of GCs analyzed are indicated in the legend of the graph. (C and D) Representative pre- and post-photoconversion images of severed control (C) or miR-182 morphant (D) axons. Values are mean ±, SEM (B). Kruskal-Wallis test, &lowast,p <, 0.05, &lowast,&lowast,p <, 0.01. Scale bars, 10 &mu,m (C and D). Cont, control, LPS, local protein synthesis, MO, morpholino oligomer. See also Figure S6. ,
Last Updated: 2017-04-05