Direct reprogramming of fibroblasts into renal tubular epithelial cells by defined transcription factors
Kaminski et al. Nat Cell Biol. 2016 Nov 7. doi: 10.1038/ncb3437.
Direct reprogramming can convert one cell type into another. Based on their evolutionary conserved expression during renal organogenesis in mouse and Xenopus, Kaminski et al. identified 4 factors that are able to directly reprogram fibroblasts into renal tubule cells. Induced renal tubule epithelial cells (iRECs) are similar to their native counterparts with respect to their transcriptional profile and morphological features, and can integrate into kidney organoids and decellularized kidneys. iRECs are sensitive to nephrotoxic drugs and may facilitate disease modelling, drug testing, and regenerative approaches.
Click here to view this article at Nature Cell Biology.
Click here to view this article on Xenbase.
Click here to view this article on Pubmed.
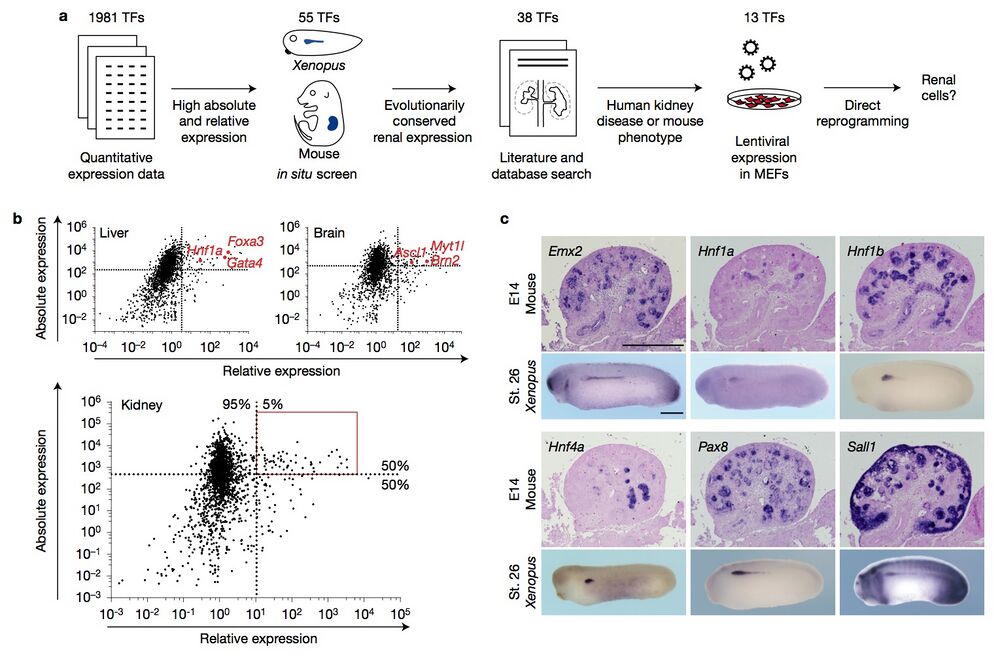
Figure 1 Systematic selection criteria identify candidate reprogramming factors. (a) A schematic illustrating the strategy and criteria used to identify renal reprogramming factors. TFs, transcription factors. (b) Scatter plots depicting the absolute and relative expression levels of transcription factors in liver, brain and kidney tissue23. Factors used for successful reprogramming to hepatocytes and neurons are highlighted in red. Dashed lines indicate the level of the 50th percentile of absolute expression and the 95th percentile of relative expression. The area boxed in red includes the 55 candidate reprogramming factors for renal cell types. (c) Representative images of in situ hybridizations of the indicated genes on E14 mouse kidney sections and stage 26 (St. 26) Xenopus whole-mount embryos. The full set of images is contained in Supplementary Figs 2 and 3. Scale bars, 500 μm.
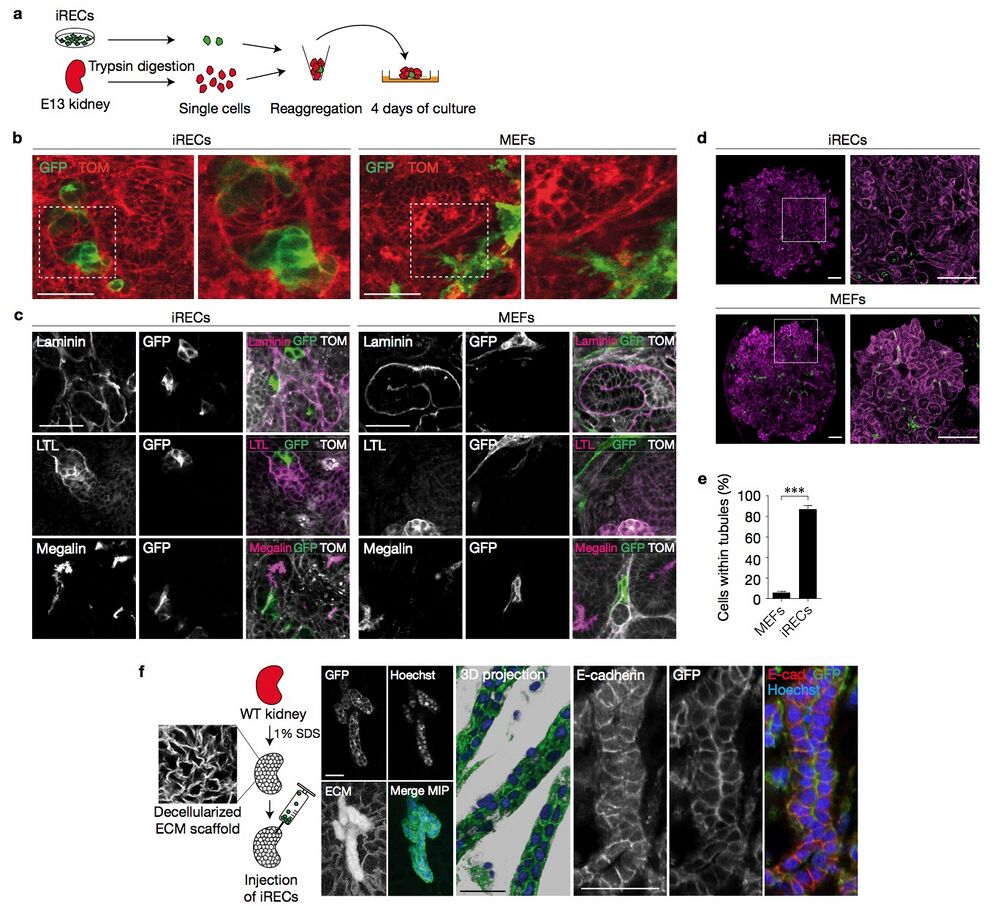
Figure 7 iRECs integrate into reaggregated renal organoids and repopulate decellularized kidneys. (a) A schematic illustration of the reaggregation assay. GFP+ iRECs and E13 TOM+ kidneys were trypsin-digested, mixed in a 1:10 ratio and grown on an air/liquid interface culture. (b) Confocal live-imaging of renal organoids reaggregated with either Ksp-Cre GFP+ iRECs or GFP- transduced control MEFs. The white boxed area is shown enlarged in the right panel. (c) Immunostaining of kidney organoids reaggregated with MEFs or iRECs for the indicated proteins. (d) Tile-scanned confocal images of entire reaggregates after staining for laminin, and enlargement of the white boxed area. (e) Quantification of GFP+ iRECs and MEFs detected inside or outside the laminin-stained basement membrane of reaggregated tubules. Error bars, s.e.m.; student’s unpaired t -test, n = 9 z -stacks, ∗∗∗ P < 0.001. (f) Schematic illustration of the repopulation assay. Wild-type (WT) kidneys were decellularized and injected with iRECs. Confocal images and 3D reconstructions of decellularized kidneys repopulated with Ksp-Cre GFP+ iRECs and immunostained for E-cadherin. Nuclei were stained with Hoechst; ECM, extracellular matrix; MIP, maximum intensity projection of confocal z -stacks. Scale bars, 50 μm (b,c,f), 200 μm (d).
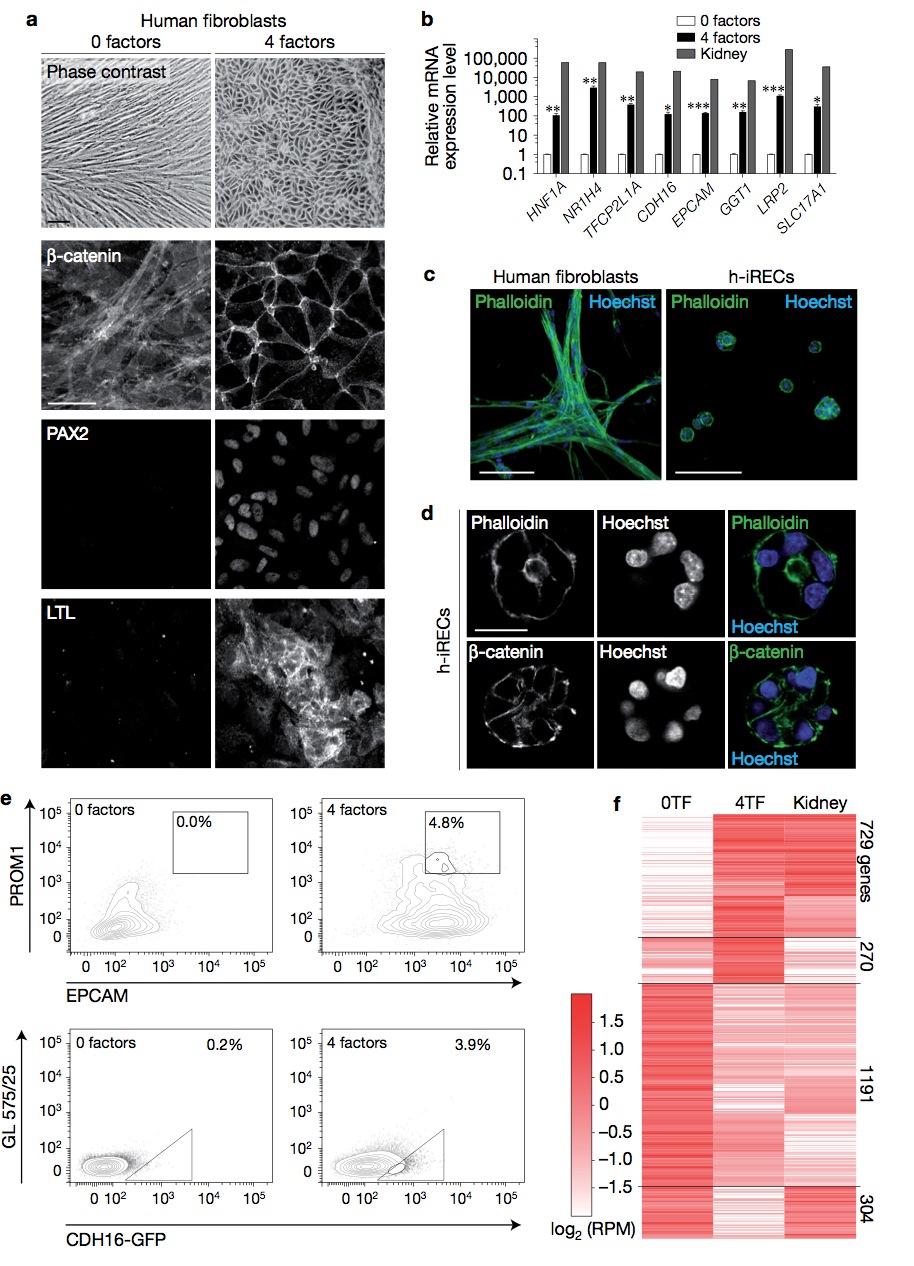
Figure 8 Reprogramming of human fibroblasts. (a) Phase-contrast image and immunostaining for the indicated proteins in untreated and 4TF- treated human fibroblasts. (b) Relative mRNA expression level of the indicated genes as determined by qPCR. Error bars, s.e.m. Significant differences were assessed by Student’s unpaired t -test, n = 3 biologically independent samples, ∗∗∗ P < 0.001, ∗∗ P < 0.01, ∗ P < 0.05. (c) Untreated human fibroblasts and human induced renal epithelial cells (h-iRECs) cultured in 3D Matrigel. Shown are maximum intensity projections of confocal z-stacks. (d) Matrigel-grown h-iREC spheres stained for actin (phalloidin) and β-catenin. (e) Percentage of PROM1+ /EPCAM+ double-positive cells (top panel) and percentage of CDH16-GFP+ cells (bottom panel) as determined by flow cytometry. 4TF human fibroblasts were treated with SV40. (f) Heatmap of RNA-seq expression analysis in human fibroblasts (0TF), CDH16-GFP+ sorted h-iRECs (4TF) and human kidney. Differentially regulated genes (0TF versus 4TFs, one-way ANOVA, P < 0.0001, n = 3 independent biological samples) were hierarchically clustered. The number of genes in each cluster is shown on the right (Pearson’s correlation coefficient 0.7). Scale bars, 50μm (a), 100 μm (c), 20 μm (d).
Reprinted by permission from Macmillan Publishers Ltd on behalf of Nature Cell Biology, copyright, Nat Cell Biol. 2016 Nov 7. doi: 10.1038/ncb3437.
Last Updated: 2016-11-14