A simple and efficient method to visualize and quantify the efficiency of chromosomal mutations from genome editing
Fu et al. (2016) Science Reports
Abstract
Genome editing with designer nucleases such as TALEN and CRISPR/Cas enzymes has broad applications. Delivery of these designer nucleases into organisms induces various genetic mutations including deletions, insertions and nucleotide substitutions. Characterizing those mutations is critical for evaluating the efficacy and specificity of targeted genome editing. While a number of methods have been developed to identify the mutations, none other than sequencing allows the identification of the most desired mutations, i.e., out-of-frame insertions/deletions that disrupt genes. Here we report a simple and efficient method to visualize and quantify the efficiency of genomic mutations induced by genome-editing. Our approach is based on the expression of a two-color fusion protein in a vector that allows the insertion of the edited region in the genome in between the two color moieties. We show that our approach not only easily identifies developing animals with desired mutations but also efficiently quantifies the mutation rate in vivo. Furthermore, by using LacZα and GFP as the color moieties, our approach can even eliminate the need for a fluorescent microscope, allowing the analysis with simple bright field visualization. Such an approach will greatly simplify the screen for effective genome-editing enzymes and identify the desired mutant cells/animals.
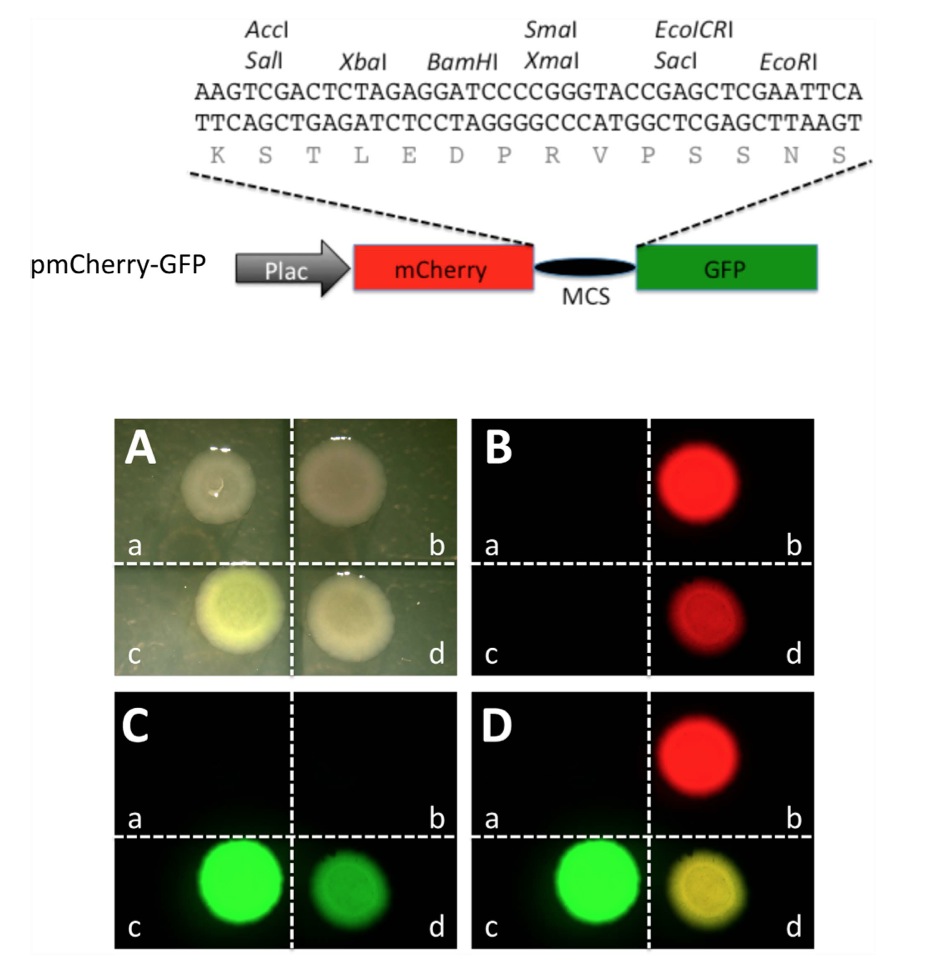
Figure 1. A construct containing mCherry and GFP coding regions separated by an in frame linker sequence allows the expression of a fusion protein in which the mCherry and GFP moieties fluoresce independently in bacteria. Top panel: Schematic representation of a plasmid construct for in-frame expression of mCherry and GFP (pmCherry-GFP). A sequence derived from pUC19 that contains multi-cloning sites (MCS) was inserted in between the mCherry and GFP coding regions under the control of the promoter of the bacterial lac operon (Plac). The inserted MCS sequence allows in frame translation of both mCherry and GFP separated by a linker peptide encoded by the MCS as shown. Bottom panel: When transfected into bacteria, pmCherry-GFP allows the expression of a fusion protein with both the mCherry and GFP moieties functioning independently. Bacteria were transformed with empty vector pUC19 (a), constructs expressing only mCherry (b) or GFP (c), or pmCherry-GFP (d), respectively. The transformed bacteria were plated and imaged in the bright field (A), or under a fluorescent microscope for red fluorescence (B) and green fluorescence (C), respectively. Red and green fluorescent imagines were merged in (D). Note that when transformed with pmCherry-GFP, both mCherry and GFP were functional, leading to a merged yellow image.
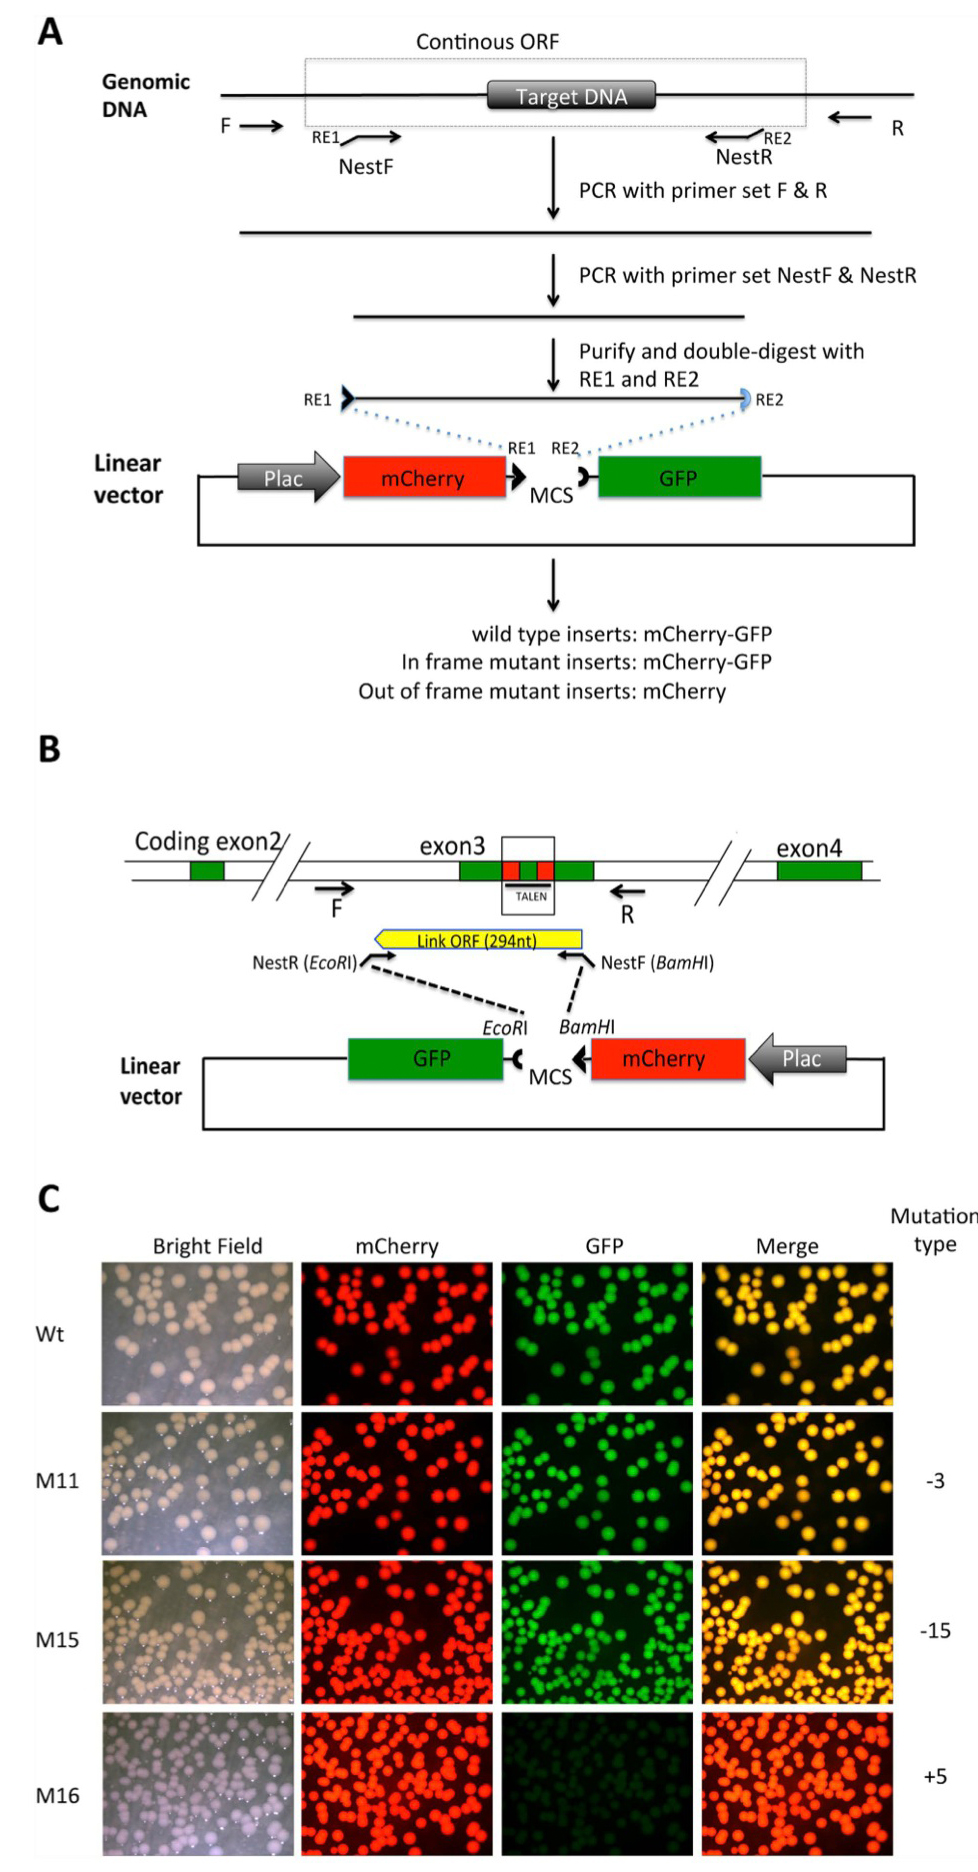
Figure 2. Shifting open reading frame upon inserting DNA into the MCS of the pmCherry-GFP construct leads to the loss of functional GFP moiety . (A) Diagram for cloning a genomic DNA fragment encompassing the region targeted by genome editing. Primers R and F are used to amplify a genomic fragment containing the targeted region. Two nested primers, NestF, with the recognition site by a restriction enzyme RE1 at the
5′-end, and NestR, with the recognition site by a restriction enzyme RE2 at the 5′-end, are designed to amplify a smaller fragment that is a continuous ORF in the wild type genome. The smaller fragment is purified and cleaved with RE1 and RE2 and dephosphorylated (to prevent self ligation of the fragment). The fragment is then cloned into pmCherry-GFP predigested with RE1 and RE2. The plasmid is then transformed into bacteria. If the PCR fragment is from wild type genomic DNA, a fusion protein of mCherry and GFP will be made in the bacteria. If genome editing leads to an in-frame mutation, a fusion protein of mCherry and GFP will also be made. If genome editing leads to an out-of-frame mutation or stop codon, the fusion protein will contain only mCherry but no functional GFP. (B). Diagram for cloning a genomic DNA fragment encompassing the region targeted by TALEN in the Xenopus tropicalis TRα gene. For the wild type genome, a fragment of 294 bp flanking the TALEN target site will be inserted into the pmCherry-GFP construct to produce a fusion protein with functional mCherry and GFP. (C). Inserting an out-of-frame but not an in-frame mutant fragment from the TRα gene disrupts GFP function. The PCR fragments amplified from the wild type DNA (Wt), two known in-frame deletion mutants (M11 and M15 with deletions of 3 and 15 bp, respectively) or an out-of-frame mutant (M16, with a 5 bp insertion) were cloned into pmCherry-GFP. The resulting plasmids were transformed into bacteria. The bacterial plates were visualized for mCherry and GFP. The merged mCherry and GFP images were shown in the last column.
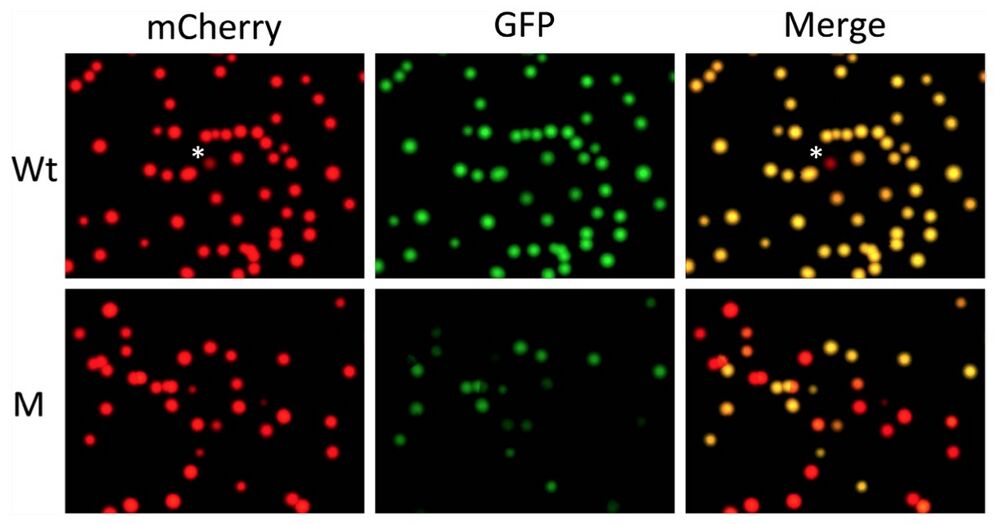
Figure 3. Quantifying out-of-frame mutation rate in F0 generation tadpoles produced with a TALEN targeting TRα gene in Xenopus tropicalis by using pmCherry-GFP construct. The mRNAs encoding the left and right arms of a TALEN targeting TRα as shown in Fig. 2B were injected into fertilized egg and the animals were reared into tadpole stage (see16 for details). A number of the resulting tadpoles (M) were euthanized together and the total genomic DNA was isolated. Genomic DNA was also isolated from wild type tadpoles (Wt). The TRα region from the Wt and M tadpoles was cloned into pmCherry-GFP and analyzed as shown in Fig. 2. Note that the yellow colonies in the merged panels represented the colonies with wild type TRα DNA inserted into pmCherry-GFP or colonies with in-frame mutations in the TRα DNA inserted into pmCherry- GFP. The red colonies in the merged image represented colonies with out-of-frame mutations in the TRα DNA inserted into pmCherry-GFP. *The single red colony from wild type genomic DNA plate. Sequencing of the colony revealed a point mutation leading to an in-frame stop codon in the TRα fragment, likely due to polymorphism at the site in the Xenopus genome or mutation introduced by PCR amplifications. Based on the number of red and yellow colonies in the merged panel, the out-of-frame mutation rate in the TRα gene due to TALEN can be determined (see Table 2 and text for details).
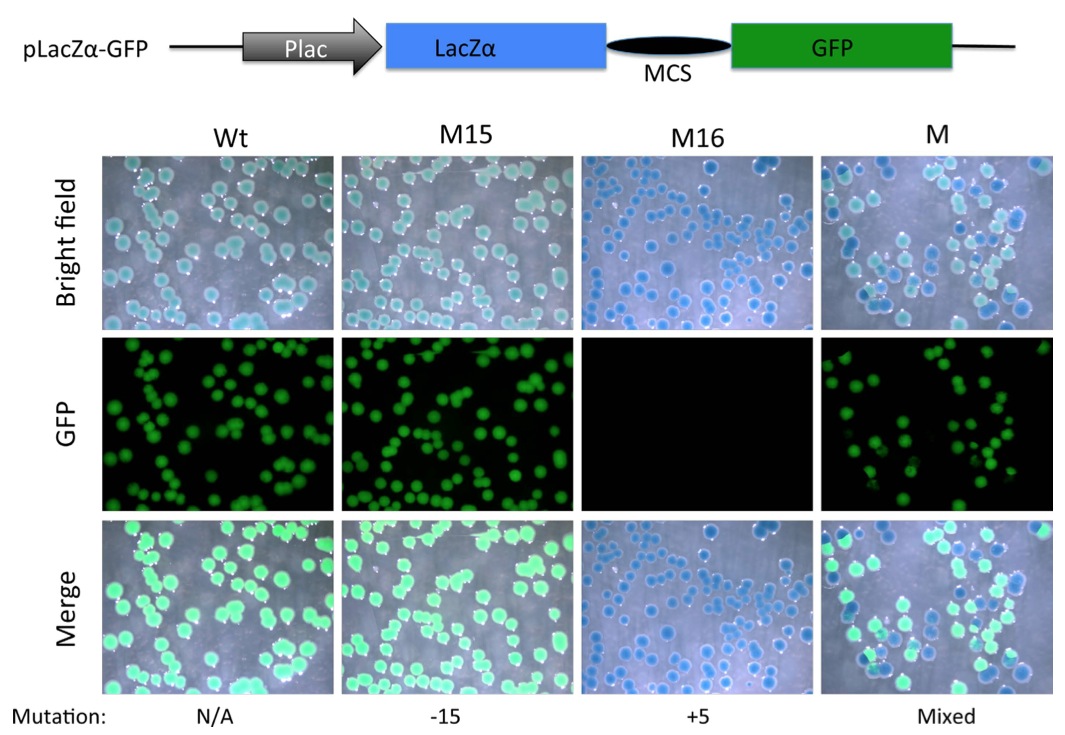
Figure 5. Substitution of mCherry coding region with that of LacZα allows detection of out-of-frame mutations with a combination of X-gal staining and a simple fluorescent microscope (without a need to resolve red vs. green fluorescence). A PCR fragment flanking the TALEN targeting site in TRα gene in Xenopus tropicalis was amplified with the NestF(BamHI) and NEstR(EcoRI) from genomic DNA isolated from a wild type tadpole (Wt), a tadpole with a known in-frame deletion (M15 with a deletion of 15 bp) or an out-of- frame mutant (M16, with a 5 bp insertion) shown in Fig. 2C, or mutant F0 TRα TALEN tadpoles (Fig. 3). The amplified fragment was cloned into the BamHI and EcoRI double-digested pLacZα-GFP (same as pmCherry- GFP except the mCherry sequence has been replaced with LacZα sequence, illustrated on top). The resulting plasmids were transformed into bacteria. The bacterial plates were stained with X-gal. Pictures were taken under the bright field (Bright Field) to visualize X-gal staining (blue) or under a fluorescent microscope for GFP. Note that colonies from plasmid containing Wt DNA or DNA with the in-frame deletion of 15 bp were greenish blue under the bright field, likely reflecting the blue color of the X-gal staining plus weak green color due to the GFP under visible light. On the other hand, a 5 bp insertion caused frame shift and disrupted GFP function, leading to pure blue colonies in the bright field or merged images. Colonies from the mutant tadpole (M) were a mixture of blue (lack of GFP) or greenish blue colonies in the bright field.
Click here to view this article at Science Reports.
Click here to view this article on Xenbase.
Click here to view this article on Pubmed.
Adapted with permission from Macmillan Publishers Ltd: Fu et al. (2016). A simple and efficient method to visualize and quantify the efficiency of chromosomal mutations from genome editing. Sci Rep. 2016 Oct 17;6:35488. doi: 10.1038/srep35488, copyright (2016).
This work is licensed under a Creative Commons Attribution 4.0 International License. The images or other third party material in this article are included in the article’s Creative Commons license, unless indicated otherwise in the credit line; if the material is not included under the Creative Commons license, users will need to obtain permission from the license holder to reproduce the material. To view a copy of this license, visit http://creativecommons.org/licenses/by/4.0/