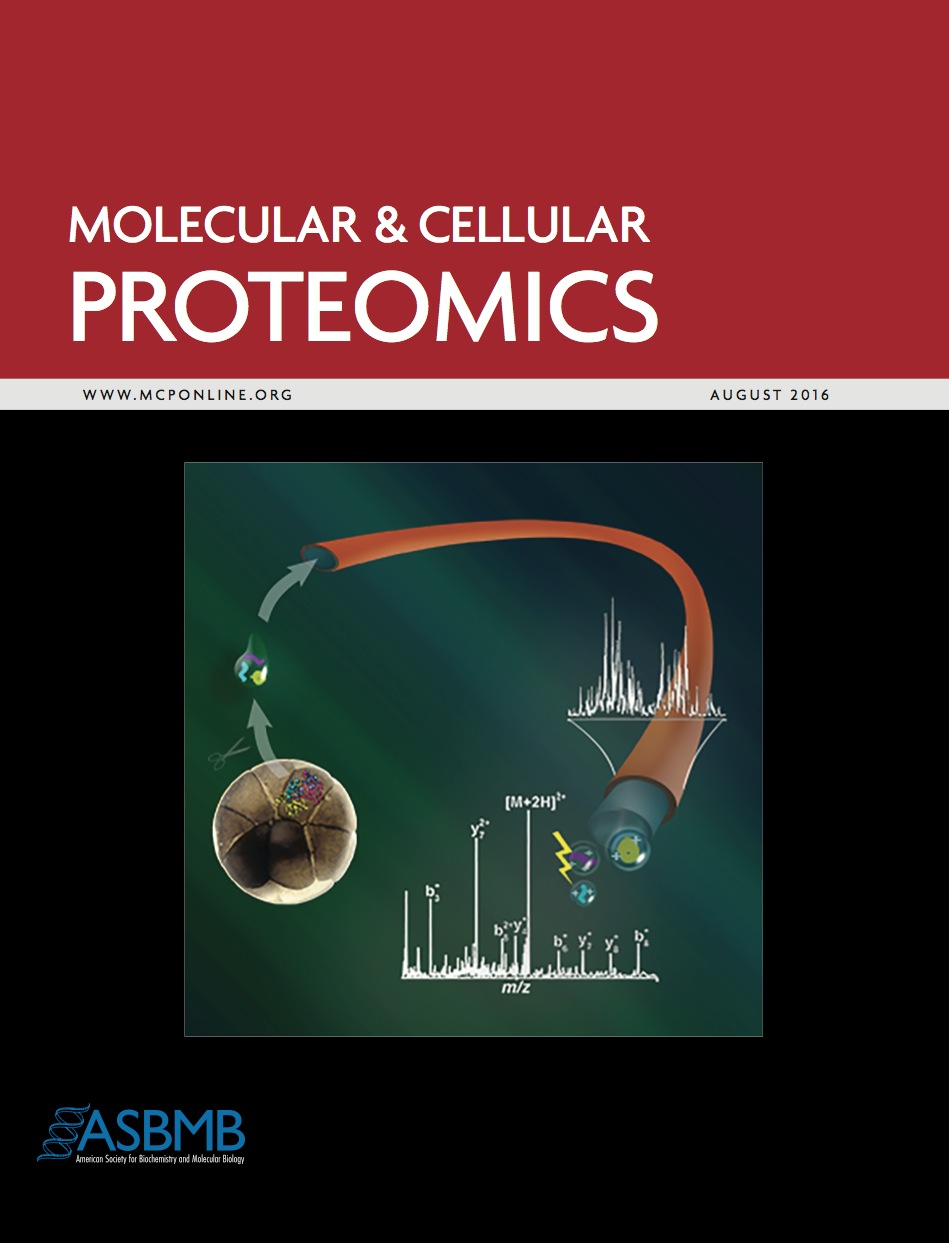
Single-cell mass spectrometry comparing metabolites in left and right cells in the 8-cell Xenopus laevis embryo
Onjiko et al. published in the journal, Analyst, using single-cell mass spectrometry to compare left and right cells in the 8-cell Xenopus laevis embryo.
Of hundreds of different metabolites detected, 10 were found to be asymmetrically accumulated between the left and right cells.
Abstract:
Single-cell metabolic mass spectrometry enables the discovery (untargeted) analysis of small molecules in individual cells. Using single-cell capillary electrophoresis high-resolution mass spectrometry (CE-HRMS), we recently uncovered small-molecule differences between embryonic cells located along the animal–vegetal and dorsal–ventral axes of the 16-cell frog (Xenopus laevis) embryo, raising the question whether metabolic cell heterogeneity also exists along the left–right body axis. To address this question, we here advance single-cell CE-HRMS for identifying and quantifying metabolites in higher analytical sensitivity, and then use the methodology to compare metabolite production between left and right cells. Our strategy utilizes multiple solvents with complementary physicochemical properties to extract small molecules from single cells and improve electrophoretic separation, increasing metabolite ion signals for quantification and tandem HRMS. As a result, we were able to identify 55 different small molecules in D1 cells that were isolated from 8-cell embryos. To quantify metabolite production between left and right cells, we analyzed n = 24 different D1 cells in technical duplicate–triplicate measurements. Statistical and multivariate analysis based on 80 of the most repeatedly quantified compounds revealed 10 distinct metabolites that were significantly differentially accumulated in the left or right cells (p < 0.05 and fold change ≥1.5). These metabolites were enriched in the arginine–proline metabolic pathway in the right, but not the left D1 cells. Besides providing analytical benefits for single-cell HRMS, this work provides new metabolic data on the establishment of normal body asymmetry in the early developing embryo.
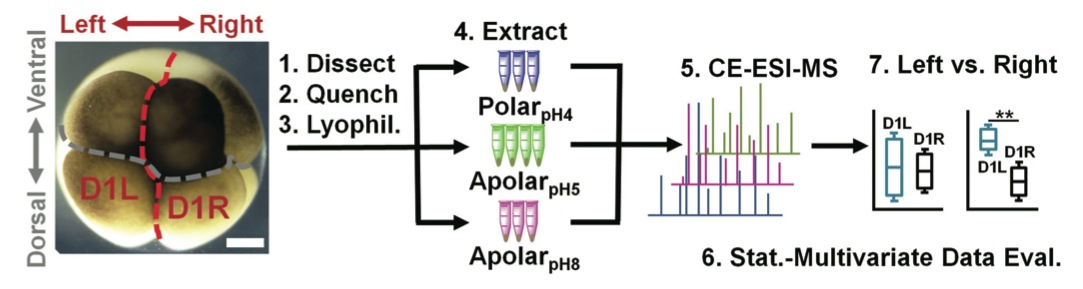
Fig. 1 Experimental strategy to identify and quantify small molecules in D1 blastomeres in the 8-cell Xenopus embryo. Different D1 blastomeres were extracted using solvents with complementary physicochemical properties to enhance the detectable portion of the single-cell metabolome and assess metabolic differences between blastomeres on the left and right sides of the embryo. Scale bar = 200 μm.
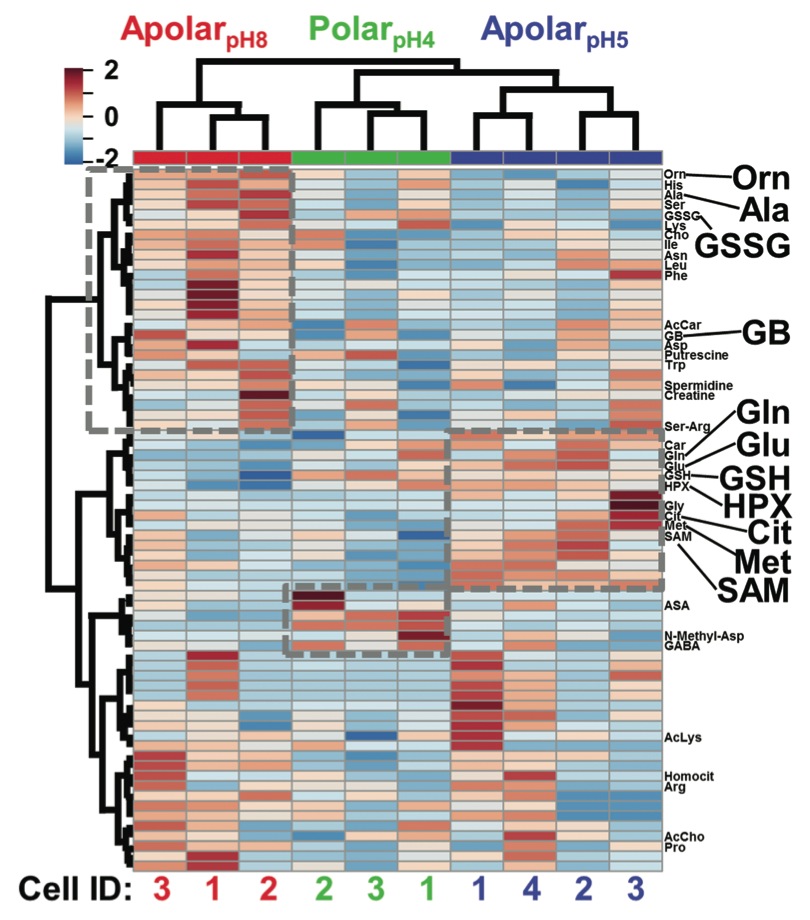
Fig. 3 HCA-heat map identifying differential metabolite extraction from single D1R blastomeres using the 3 solvents. The plot was calculated for the 70 most statistically significant differences. Individual blastomeres with unique cell identifiers (Cell ID) are shown on the horizontal axis (see bottom axis). Different molecular features are shown on the vertical axis (see right axis). Dashed boxes exemplify quantitative chemical differences between the extracts. Metabolites with statistically significant differences in abundance based on Fisher’s LSD are labeled (see also Table S3†). Metabolites are shown in three-letter codes. Key: Cit, citrulline; GB, glycine betaine.
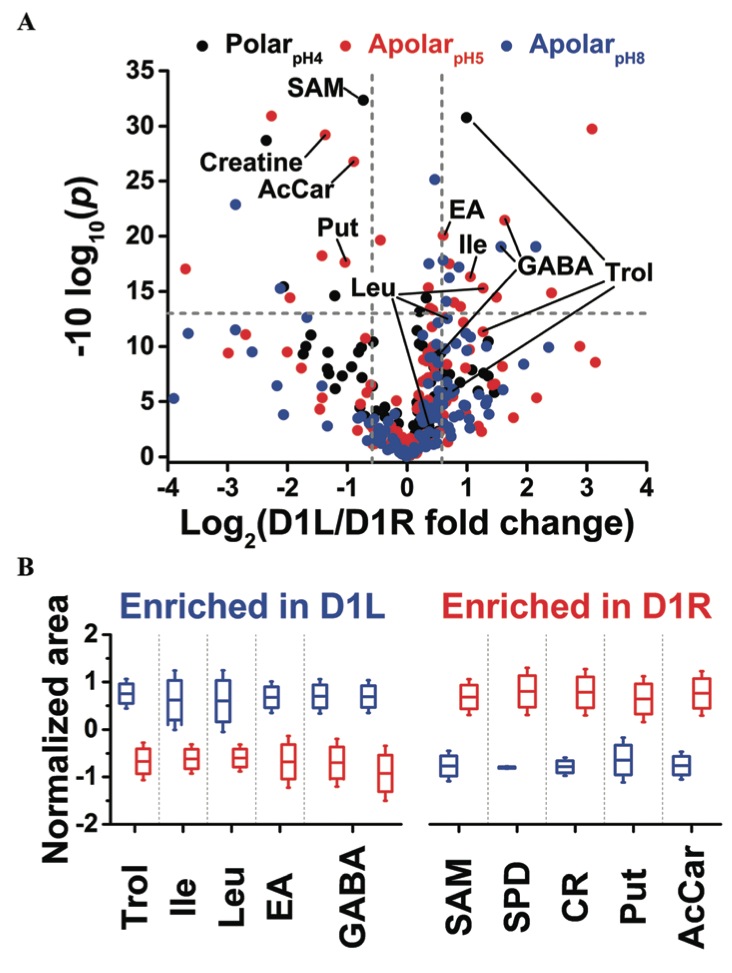
Fig. 4 Differential metabolite enrichment between D1 blastomeres on the left (D1L) and right (D1R) sides of the 8-cell Xenopus embryo. (A) Volcano plot compares signal differences between D1L/D1R cell extracts prepared using the three solvents. Dashed lines (grey) mark thresholds for statistical significance (p < 0.05) and biological importance (fold change ≥1.5). (B) Relative comparison of differentially enriched, identified metabolites.
Click here to view this article on Pubmed.
Click here to view this article at Analyst.
______________________________________________________________
Images and text used with permission by The Royal Society of Chemistry.
Single-cell mass spectrometry with multi-solvent extraction identifies metabolic differences between left and right blastomeres in the 8-cell frog (Xenopus) embryo
Rosemary M. Onjiko, Sydney E. Morris, Sally A. Moody, and Peter Nemes
Analyst, 2016,141, 3648-3656 DOI: 10.1039/C6AN00200E
______________________________________________________________
Please see this additional article:
Label-free Quantification of Proteins in Single Embryonic Cells with Neural Fate in the Cleavage-Stage Frog (Xenopus laevis) Embryo using Capillary Electrophoresis Electrospray Ionization High-Resolution Mass Spectrometry (CE-ESI-HRMS)
Camille Lombard-Banek, Sushma Reddy, Sally A. Moody and Peter Nemes
Mol. Cell. Prot. 2016, 15, 2756-2768.
Abstract:
Quantification of protein expression in single cells promises to advance a systems-level understanding of normal development. Using a bottom-up proteomic workflow and multiplexing quantification by tandem mass tags, we recently demonstrated relative quantification between single embryonic cells (blastomeres) in the frog (Xenopus laevis) embryo. In this study, we minimize derivatization steps to enhance analytical sensitivity and use label-free quantification (LFQ) for single Xenopus cells. The technology builds on a custom-designed capillary electrophoresis microflow-electrospray ionization high-resolution mass spectrometry platform and LFQ by MaxLFQ (MaxQuant). By judiciously tailoring performance to peptide separation, ionization, and data-dependent acquisition, we demonstrate an ∼75-amol (∼11 nm) lower limit of detection and quantification for proteins in complex cell digests. The platform enabled the identification of 438 nonredundant protein groups by measuring 16 ng of protein digest, or <0.2% of the total protein contained in a blastomere in the 16-cell embryo. LFQ intensity was validated as a quantitative proxy for protein abundance. Correlation analysis was performed to compare protein quantities between the embryo and n = 3 different single D11 blastomeres, which are fated to develop into the nervous system. A total of 335 nonredundant protein groups were quantified in union between the single D11 cells spanning a 4 log-order concentration range. LFQ and correlation analysis detected expected proteomic differences between the whole embryo and blastomeres, and also found translational differences between individual D11 cells. LFQ on single cells raises exciting possibilities to study gene expression in other cells and models to help better understand cell processes on a systems biology level.
This research was originally published in Molecular & Cellular Proteomics. C. Lombard-Banek, S. Reddy, S. A. Moody, and P. Nemes, Label-free Quantification of Proteins in Single Embryonic Cells with Neural Fate in the Cleavage-Stage Frog (Xenopus laevis) Embryo using Capillary Electrophoresis Electrospray Ionization High-Resolution Mass Spectrometry (CE-ESI-HRMS), Mol. Cell. Prot. 2016, 15, 2756-2768. © the American Society for Biochemistry and Molecular Biology.
Click here to view this article at Pubmed.
Click here to view this article at Molecular & Cellular Proteomics.